This is taking the associations of bacteria to symptoms found for the entire population and applying it to the symptoms you have recorded and your uploaded microbiome.
If you have not recorded your symptoms, nothing will appear.
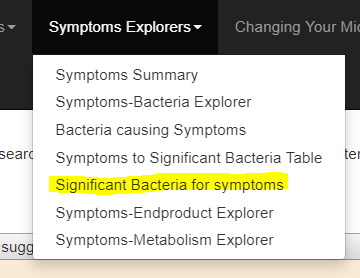
After you have logged on, a new menu item will appear:
When you select this, you will be taken to the new page.
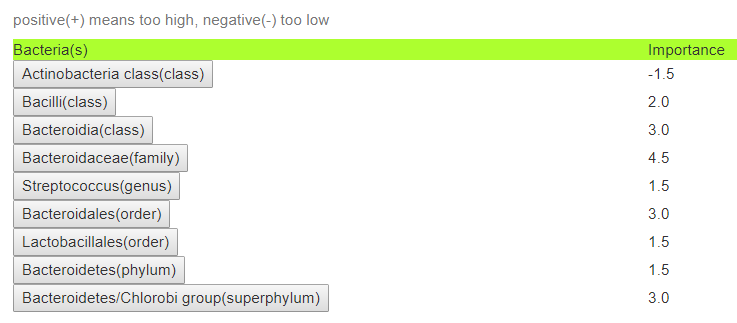
Mine when relatively symptomless
The number can vary greatly — only precise matches are shown. In some cases species will be shown.
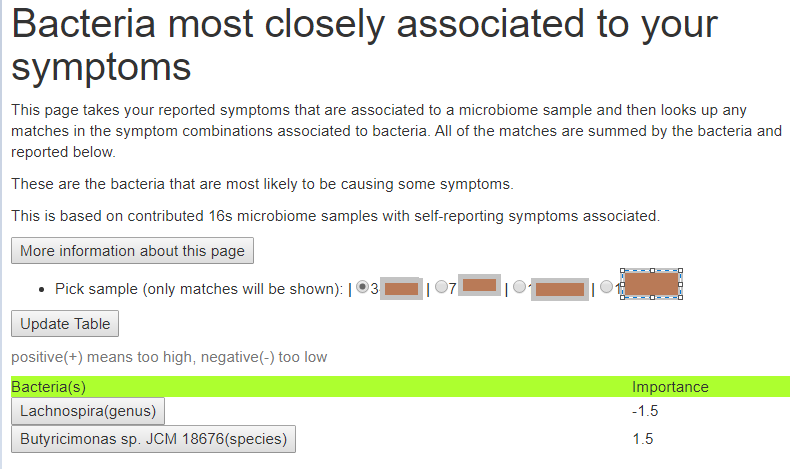
This is mine during a myalgic encephalomyelitis flare.
Above, Streptococcus(genus) parents are Lactobacillales(order) and Bacilli (class).
This new page, shows the pattern for Symptoms found with statistically significant correlation to some bacteria.
Reminder
We do this by looking at all of the samples, sorting the values in order, then divide into 4 equal parts. From the equal parts we get boundaries. To check a condition, we take these boundaries and see how many fall into each. If there is no relationship, then the numbers in each of these 4 parts should be equal. If they are not, and are very different, we can compute the odds of this happening by random chance. If the computed odds is too low, we say that there is likely a real relationship involved. The Expected column is what we would expect to see in each of the 4 parts, it will help you see what is abnormally high or low (or both).
Looking at the first row, we see that no Health Issues is associated with most of these people having very low numbers of a specific Anaerotruncus species.
Further down, we see that a Dora Species tend to be clustered below average for Females. For Butyricimonas, there may be two pattern – one very low (31) and the other in the median high (22). Why is a matter of speculation.
You have the ability to look at different ranks of bacteria taxonomy, as well as the number of symptom combinations.
How does my Microbiome compare?
If you have uploaded your microbiome and are logged on, you will see your various samples listed. Picking one of them will show where you have a match.
The matches are to the highest frequency in the pattern. Your value is show in pink.
Remember – this is not PREDICTIVE. just showing associations.
Look at the matches and compare to your symptoms. If you have those symptoms THEN the bacteria is likely a significant player. You want to move your values towards the middle (increase or decrease).
This week I applied an old technique to microbiome analysis which I remember using to solve some messy problems that I was dealing with professionally back in 1982. The solution was to return to the question or assumption without going down the path mostly travelled.
Almost all of the microbiome analysis studies that I have read contains wording such as shown below. The study focused on ratios of bacteria and not relative distribution patterns of bacteria.
demonstrated that the dysbiosis could be characterized as directed alteration of the microbiome composition leading to greater disparity between relative abundance of two phyla, Bacteroidetes (Z = 4.77, q = 1.59 × 10) and Firmicutes (Z = -3.87, q = 5.83 × 10).
I will jump into the real world to explain a bit how we do this.
In the non-microbiome world
Suppose the question is whether there is wage disparity between Canadians and Australians working in Silicon Valley. The classic test is to find the average wage of each and see if there are significantly different. This is the approach done in microbiome studies.
Instead, a clever data scientist decides to get the actual wage from everyone and then divide the wages into the lowest quarter (25%), low quarter (25%), high quarter(25%) and top quarter (25 %). You would expect the number of Canadians and Australians to be roughly equal in each — but it is possible (with the same average) for them to be very different, for example:
0-25%: Australian 40, Canadians 60
25-50%: Australian 90, Canadians 10
50-75%: Australians 30, Canadians 70
75% up: Australian 40, Canadians 60
Clearly, Australians tend to end up in 25-50% – 45% of them, and only 5% of Canadians. Some of the top pay went to Australians — resulting in the same average. Looking at it this way, we see a salary dysfunction. Not only do we see it, but we can actually determine the odds of this happening at random by doing a chi-2 test, and find that the odd > 1/10,000,000. There is a statistical significant bias in salaries.
The ability for the common person to see the issue
Below is an example for a mixture of conditions.
Bacteria Distribution Example
We see shifts towards higher values, but not the highest range. The expected amount in each quantile is between 4 and 5 (add the numbers and divide by 4). We see the highest values are often close to expected values, the dysfunction is an upward shift, but not a clear overgrowth. Looking only for overgrowths or undergrowths is why the patterns were not seen by researchers.
When I applied it to this problem, I was literally blown away with the massive number of associations exposed.
If you go to the full listing of relationships – relationships discovered when you combine multiple symptoms, you will find some 15000 items have been discovered. Fortunately, I have ordered the list in alphabetical sequence to make it easier to view. Click here to go to this page.
All of the above are sleep related, but sleep is not connected to a single bacteria. Sleep issues are likely a side-effect of the other symptoms.
The thing that I really like is the ability to click on any symptom combination and see the actual numbers.
Correcting the Microbiome
This actually gives us, in theory, a much more targeted approach. Using the microbiome and the symptoms, we can infer which bacteria are needing to be increase or decrease. We are no longer talking about high values and low values, but correcting minor shifts.
If you have the symptoms for ‘Bacteria Distribution Example’ above, and we have your microbiome, we can ask the question: Are you in Quantile3 for Flavonifractor? If so, we want to change it. We can go up or down, well, downwards has a greater difference from the expected — so we should go in that direction. KEY CONCEPT: You may not be actually in the high group for Flavonifractor, your values indicate that this was more likely an upward shift.
This becomes a very nuisance adjustment of the microbiome.
New Suggestion Page in the works
This may take me a few days to code uo and test. To use it, you will need to upload your microbiome AND also enter your symptoms/characteristics when the microbiome was taken. Both are essential for the new suggestions page in the works.
I have revised the site finding where to enter symptoms is clearer.
Finding Gender specific bacteria shown above agrees with research
Right Thinking
Almost all published studies report “found average of patients X bacteria is statistically {higher|lower} than the controls”. If you look through my Condition templates, you will see that for some conditions, one study reported high and another low — dilemma!
Not dilemma, but a hint to the nature of the problem.
Repeating the old gospel
Over the last 6 years, I have been ascribing ME/CFS ets to a microbiome dysfunction – that is, a complex shifting of bacteria that alters the metabolites that the body receives. The key work is complex shifting. It is not, too high or too low — which is a naive simplistic thinking of the issue.
Statistical tests on averages on less sensitive than using the classic Chi2 test. My revision to use the logic of BoxPlot shifted my mind to use quantiles. With quantiles, you can apply Chi2 … and suddenly relationships appear!
How do I do this, first, I look over all microbiome samples, sort each and then divide them into four parts of equal size – recording the range of values. Now for a specific subset that has a condition, I count how many fall into each range — then I apply Chi2 to see if this is statistically significant.
Constructed Example.
We have 16 samples, so 4 in each group but for those suffering from Monty Pythonism, we see that we have 8 in the lowest and 8 in the highest. The result may be that the average between these patients and the control are identical. No Significance.
In this case we see two shifts happening that has a 1/1000 odds of being random
This does not make life simpler…. you cannot say “I have symptom X, I need to reduce bacteria Y”, You can say that the balance of bacteria Y is off and needs to be adjusted (as well as things it communicates with)
For people with EBV, we see lower levels of one species in general:
In other cases, the shifts are more complex.
If a single Symptom shows no Eureka moments…
It is likely one of two situations:
Not enough samples
There are multiple symptom subsets. You need to add more symptoms to isolate the subset.