
This is a “scribe notes” post. I am working on implementing odds ratio as a forecaster for ME/CFS and encountered some issues. In my work experience, this means taking a significant step backwards to look at the data better. I will look at the bacteria with a high frequency of being reported in tests first. The genus of greatest interest from preliminary work are:
- Blautia
- Faecalibacterium
- Clostridium
- Lachnospira
- Streptococcus
- Collinsella
- Anaerostipes
- Parabacteroides
- Anaerotruncus
- Bifidobacterium
- Pseudobutyrivibrio
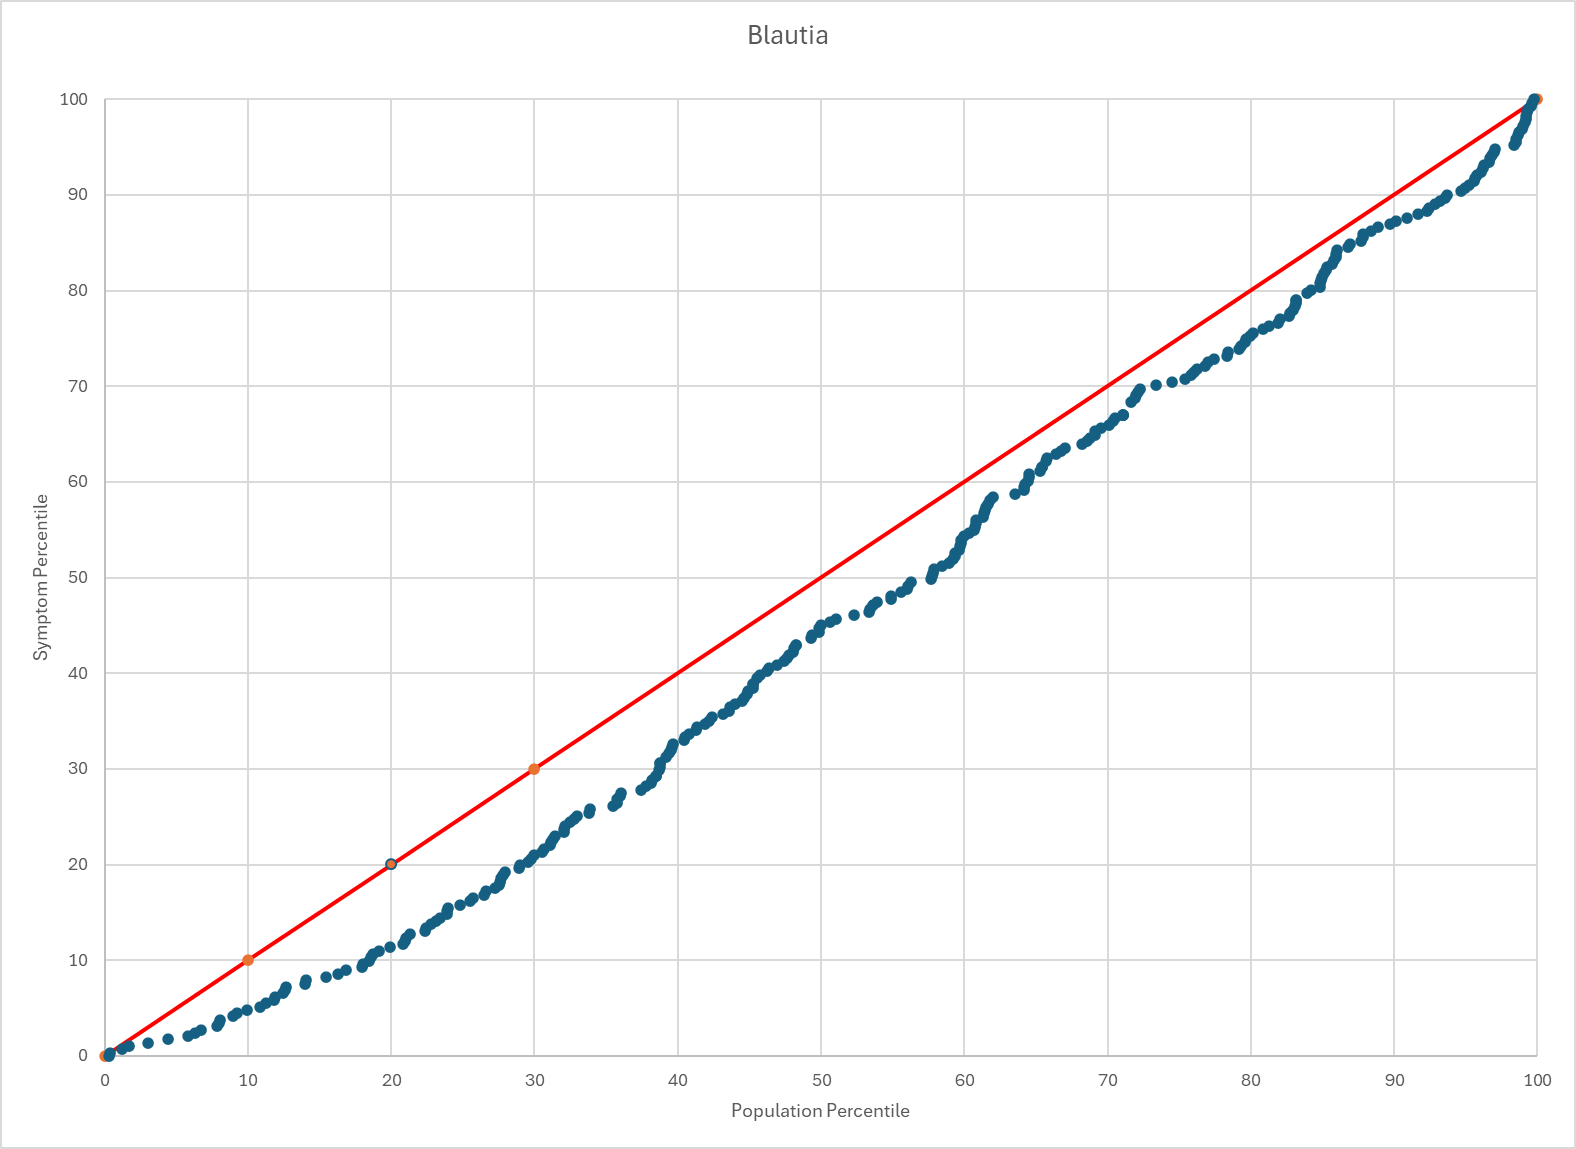
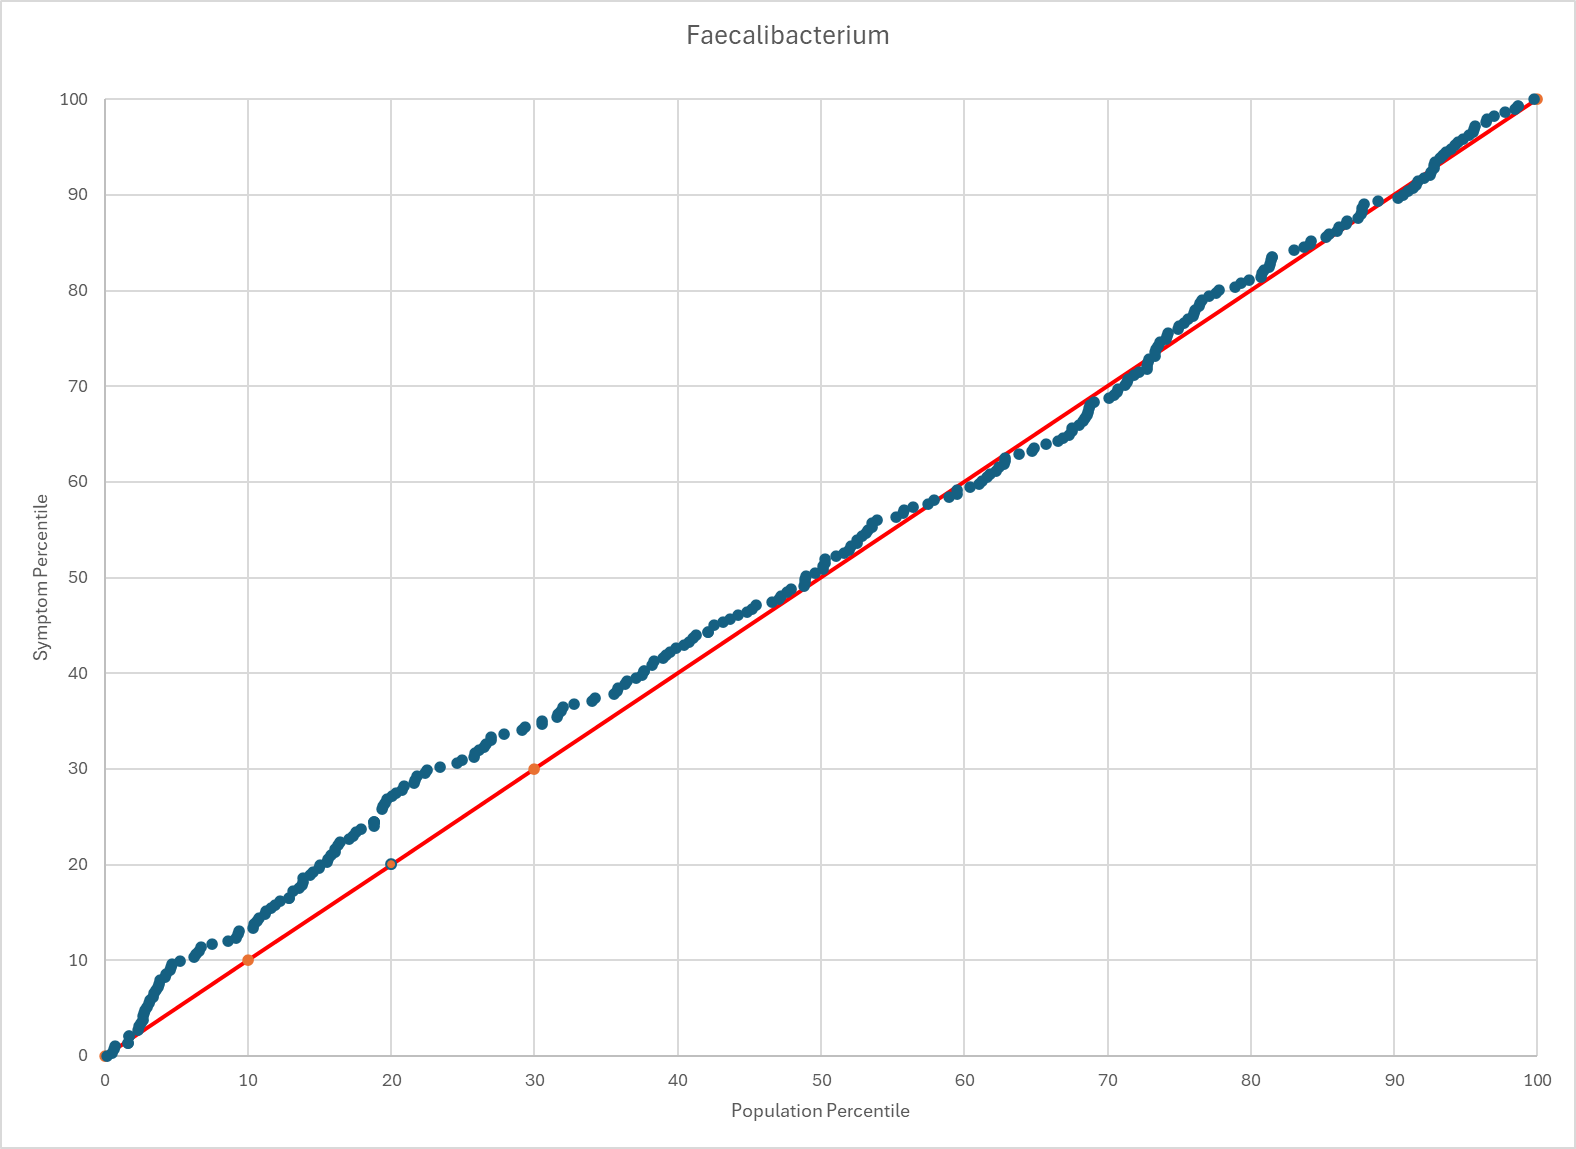
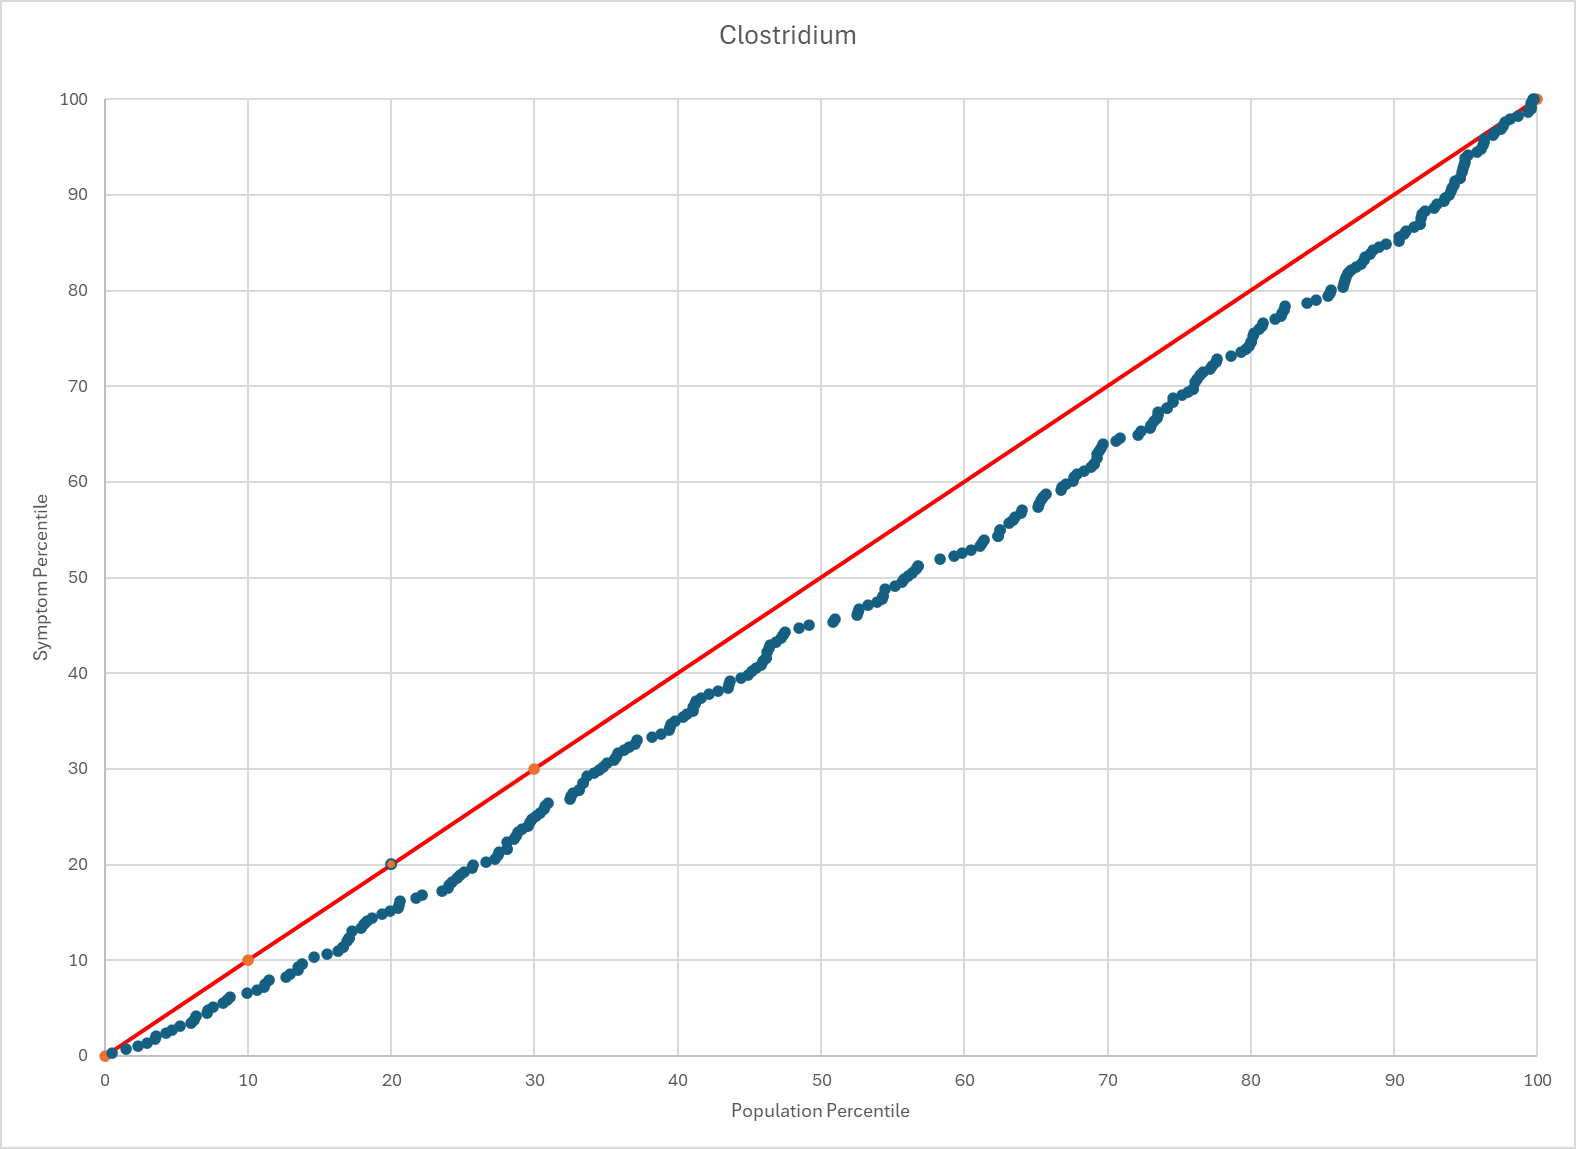
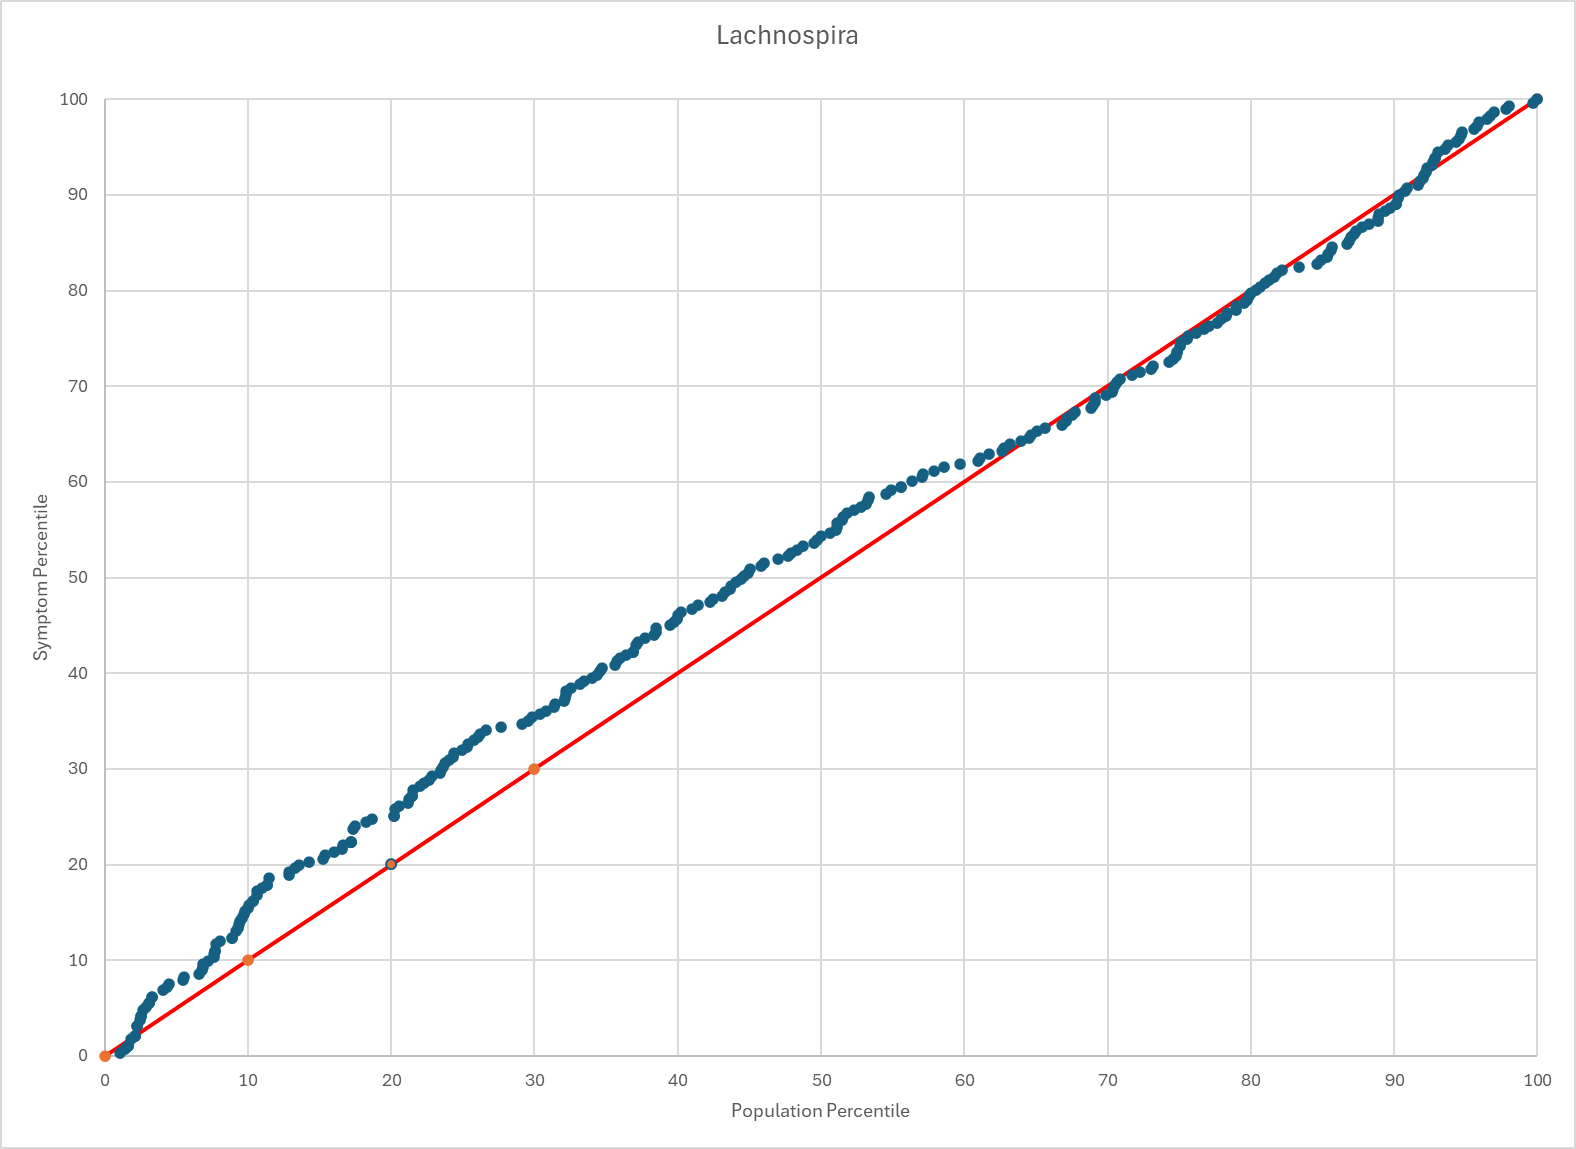
The data is from BiomeSight samples. The red line is what would be expected with no influence. The population percentile included those with ME/CFS. Removing them would increase the differences more (I went lazy).
Charts
Blautia
Lower levels are clearly significant.
Faecalibacterium
Lower levels are some significance.
Clostridium
Lower levels are clearly significant.
Lachnospira
Higher levels are some significance for low values.
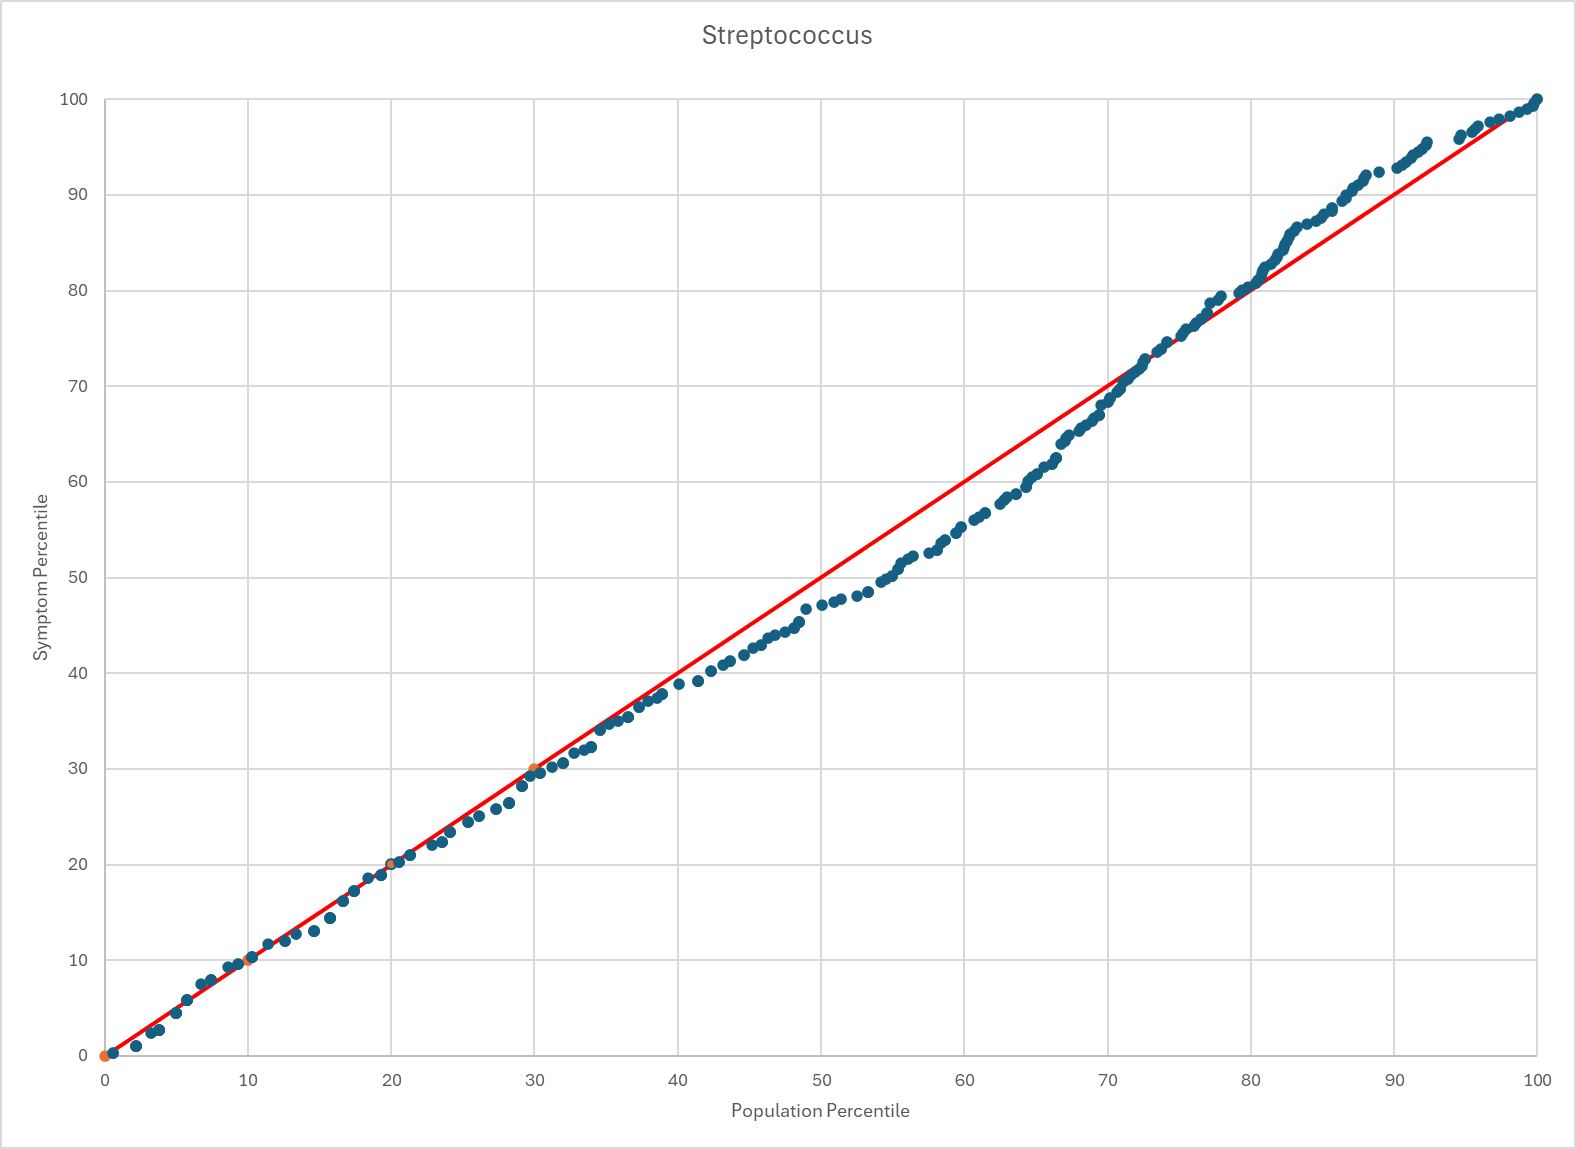
Streptococcus
Does not appear to have much significance
Collinsella
Higher levels are some significance for below average values

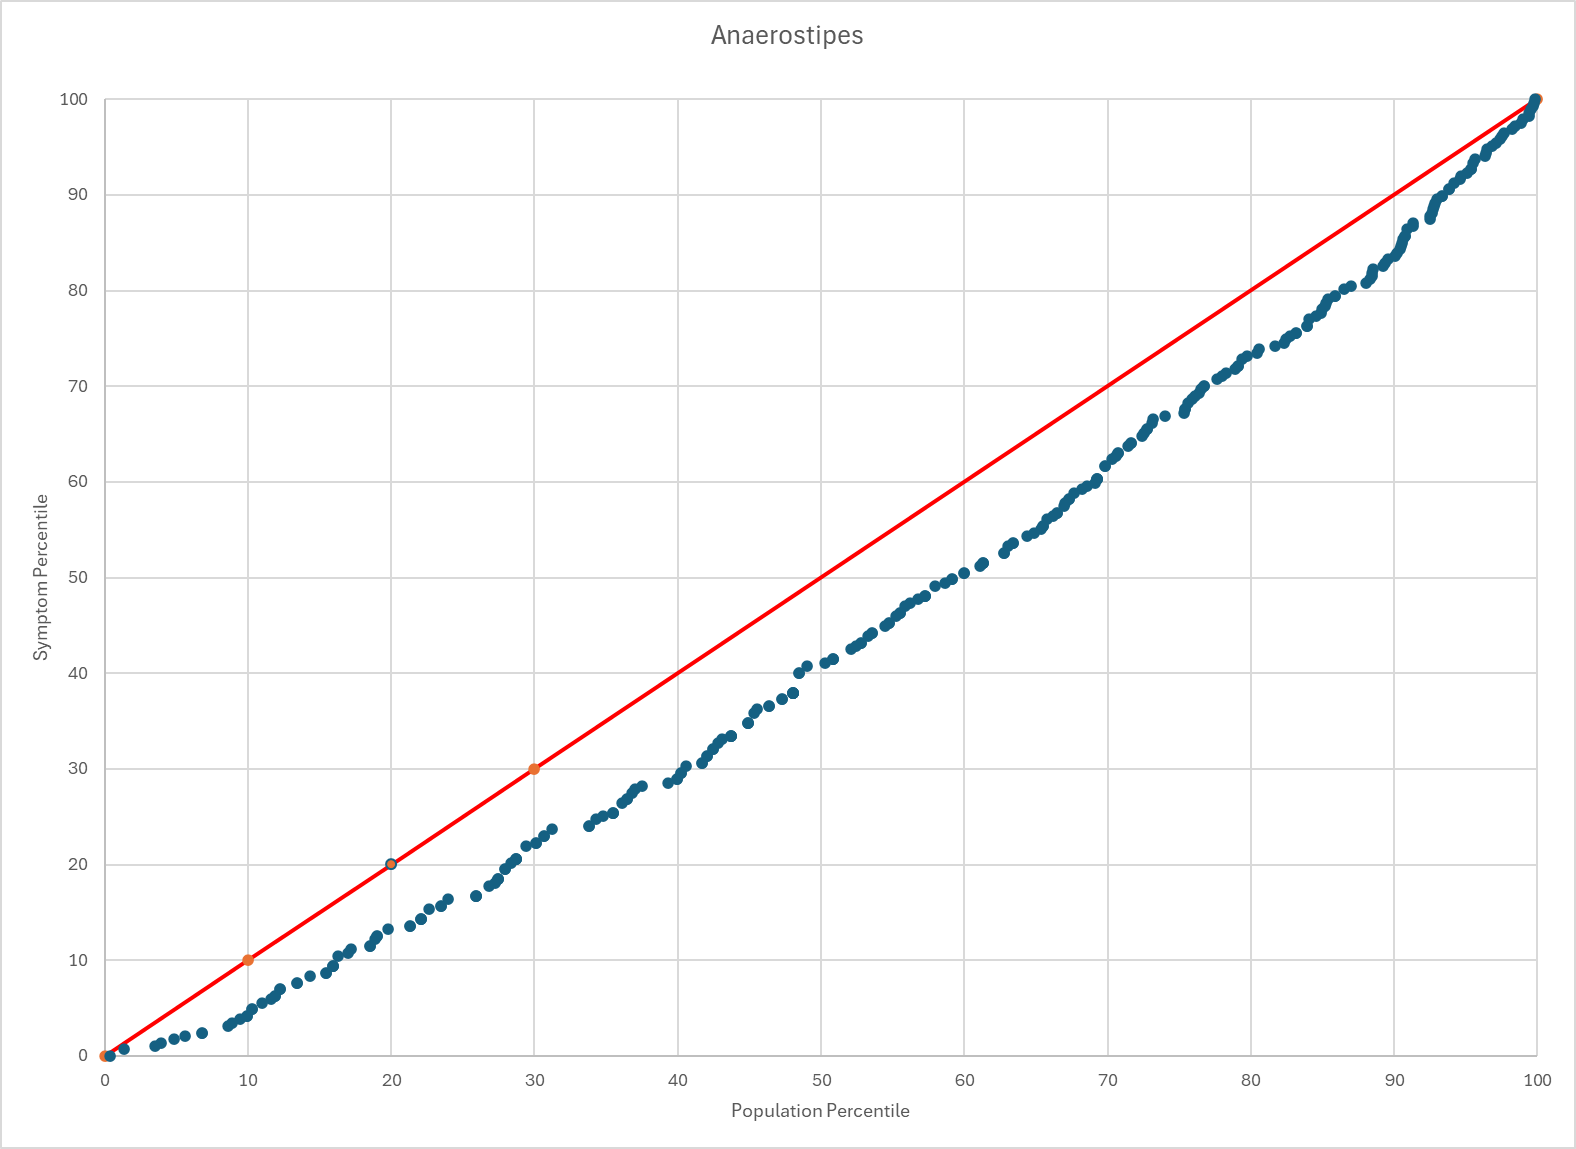
Anaerostipes
Lower levels are significance for all values.
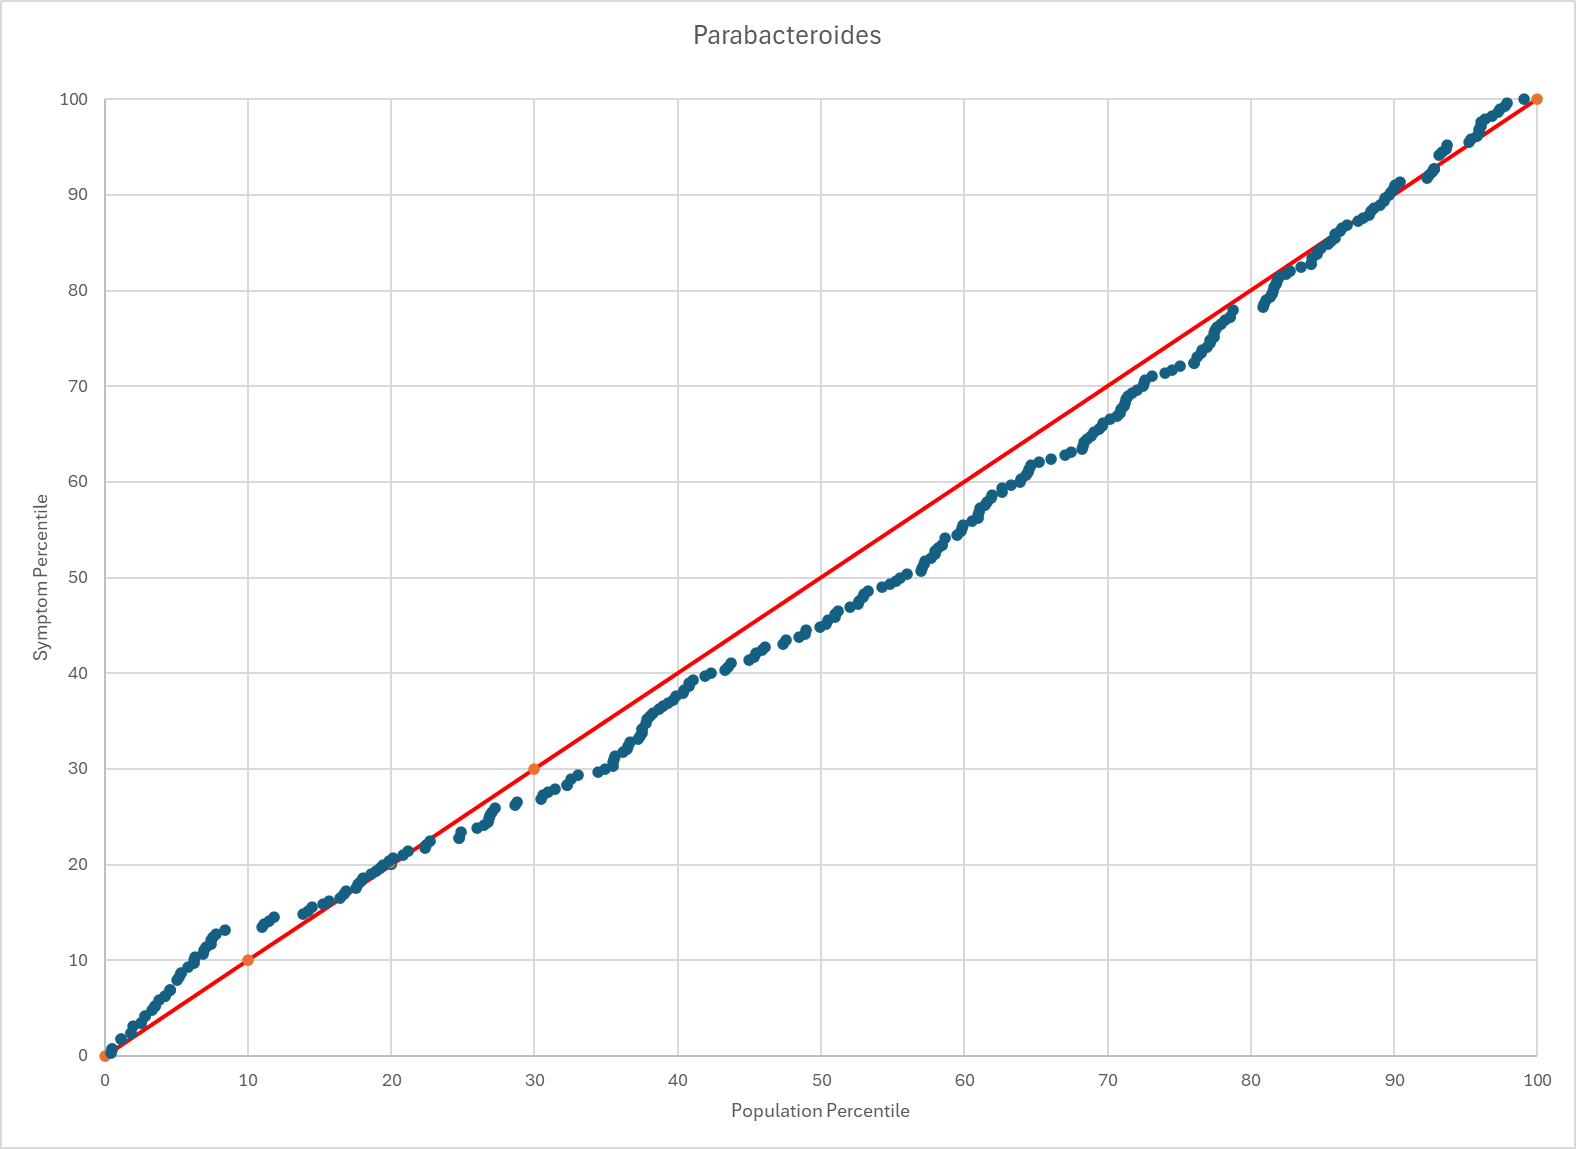
Parabacteroides
Does not appear to have much significance
Anaerotruncus
Lower levels are significance for all values.

Bifidobacterium
Higher levels are significance for all values.

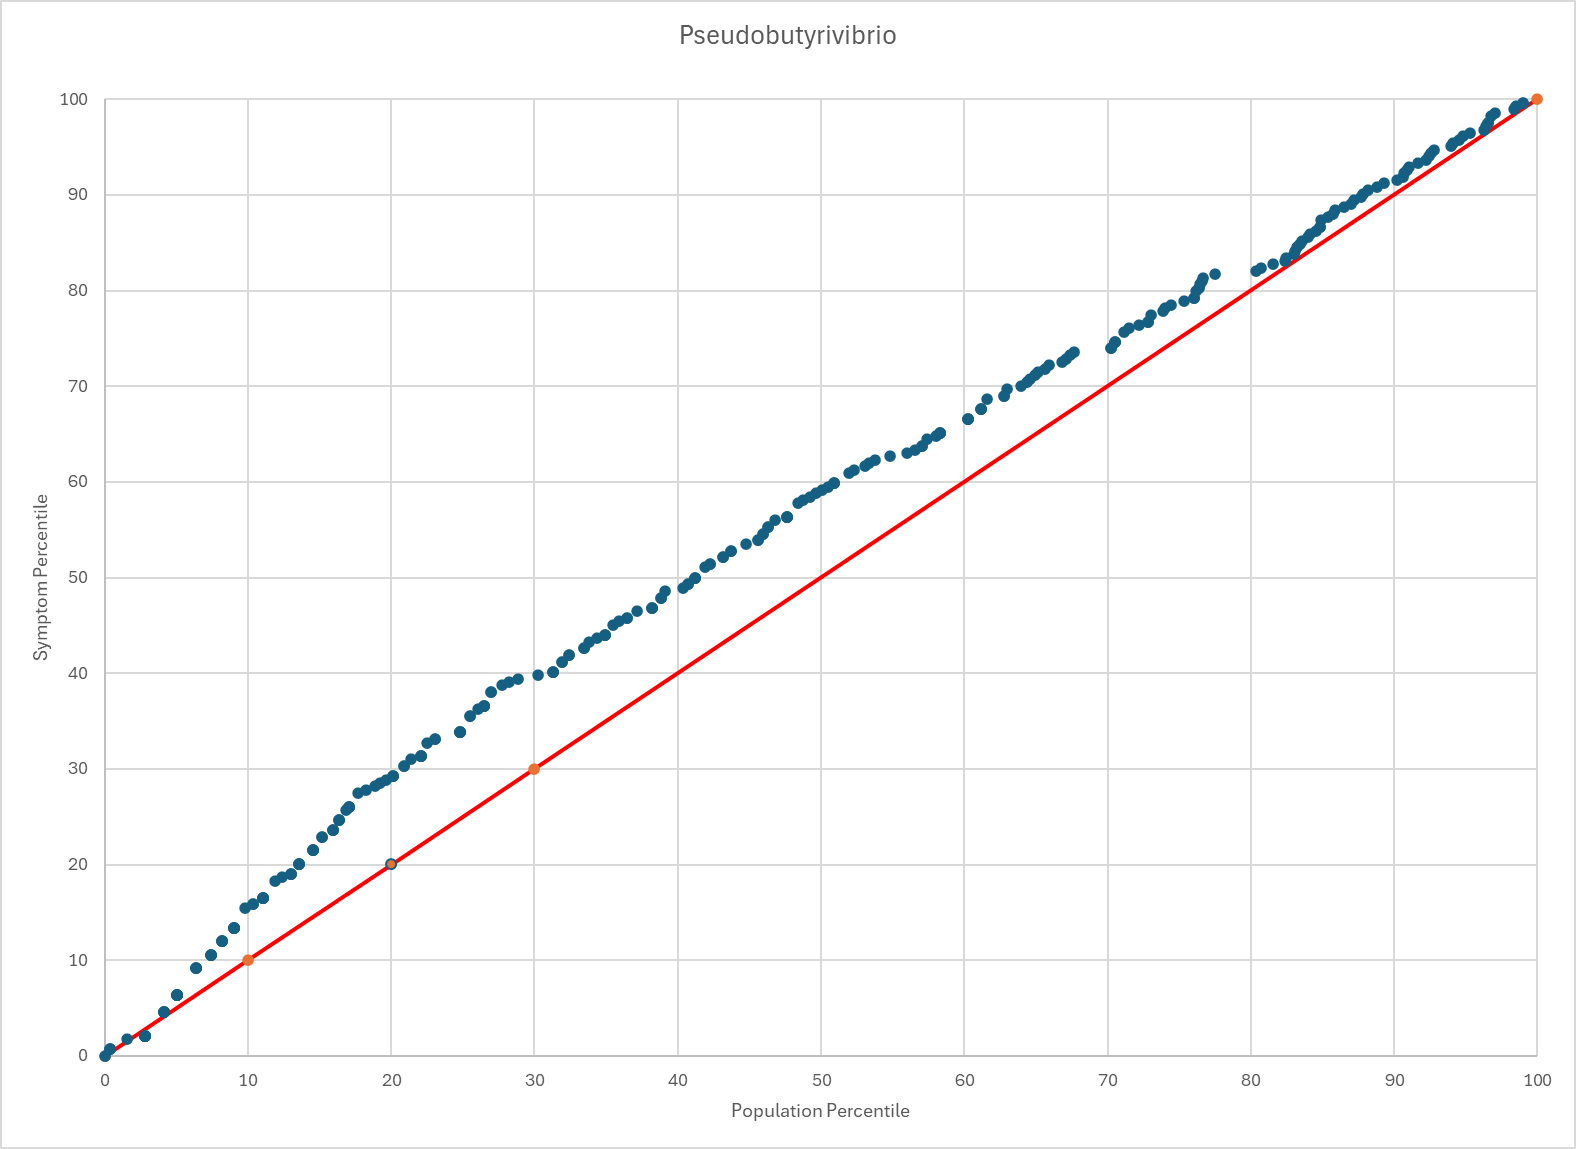
Pseudobutyrivibrio
Higher levels are significance for all values.
Next Steps
We can visually see how bacteria is shifted for these genus. The challenge is converting it to a formula to forecast that cross validates. Stay tune.
