I have been active reading research and hypothesis dealing with Myalgic encephalomyelitis/chronic fatigue syndrome for 20 years. I am also well trained in mathematics, statistics and modeling with some Ph.D. courses. Every time a new hypothesis comes out I review it to see if it is objectively better than the hypothesis that I am using.
What makes a hypothesis better?
How many observations in the literature does it give a simple direct explanation for?
Can it be used to make testable predictions?
And last, for illnesses, how long before it is actionable for treatment?
Do the actions work for a significant subset or the entire population?
For the microbiome hypothesis, the values of all of these is very high, especially the last one — you can take action today.
In this post I will review some recent posts by my long time friend, Cort Johnson.
Ten years ago, Fisher’s intuition was correct. ME/CFS patients’ mitochondria are having problems producing energy. Something that’s gone wrong in one mitochondrial complex is throwing off the rest of the complex. The good news is that the problem is not subtle: Fisher appears to be seeing major problems across the mitochondrial pathways.
Microbiome dysfunction alters the metabolites that feed the body and the mitochrondria.
The bad news is how complex the mitochondria are. Fisher doesn’t think he’s going to find a single cause that responds to a single, simple fix. He also left open the possibility that the Complex V problems could be a consequence of another as yet unknown problem.
Given the reduced thyroid hormone activity in NTIS, clinicians began, as early as the 1980s, to suggest thyroid hormone supplementation in their critical NTIS patients in an attempt to increase their survival rates (Carter et al., 1977; Brent et al., 1986 and DeGroot, 1999). This approach continues to be debated today (Davis, 2008; Kaptein et al., 2010; De Groot, 2015; De Neto et al., 2016; Breitzig et al., 2018)… Given the impaired conversion of T4 to T3 in NTIS, some researchers also propose T3 supplementation (as opposed to T4 supplementation) (Biondi, 2014).
Positive results for some subsets of patients. I have the words “positive results” because that is often wordsmithing to keep funding grants coming.
Results with thyroid supplementation have been mixed (Farwell, 2008), but have most often been beneficial (see review in Fliers et al., 2015). Interestingly, positive results have reportedly been achieved by supplementing thyroid hormones in NTIS patients who had become ill after mold exposure (Somppi, 2017)….. supplementation doses have to be very high to achieve results (Debavaye, 2008). These suggestions regarding the type and quantity of thyroid hormone supplementation in NTIS echo the arguments made by some practitioners on T3 supplementation for ME/CFS (see my previous blog post).
EBV related hypothesis has been around a long time and appears to apply to a subset. For other patients it is Q-Fever, Rickettsia, Giardiasis and Lyme. For all of these we hear terms like re-activation or occult form of the infection. While antibodies are found, those infections appear to be controlled. We now hit two paths: these turn on genes (an epigenetic change) or these cause a microbiome shift (with the change of metabolites produced perhaps triggering epigenetic changes).
We have no predictions here. Nor do we have any know actions to turn off pathogenic genes (assuming we can identify them).
Bottom Line
People often ask me what I think of this or that hypothesis. I evaluate them with the rule above. 95% of the time I quickly see that it is a speculative hypothesis “perhaps this may explain…” without sitting down and looking at the historic facts reports in decades of research. Often, I hate to say, the research is a specialist in area A and trying to see if his area of research may work for CFS — and perhaps get a grant to research.
When a new theory come across your groups, try applying the above criteria.
The numbers of PubMed studies on the human microbiome have exploded in the last few years as shown in the chart below. In the early 1990’s we had around 10 studies a year. In 2017 we reached 4421 studies — a massive increase and expect at least 4000 every year going forward.
This creates a challenge for medical professionals. Most have never received anything beyond the simplest introduction. Even recent graduates are unlikely to receive information. 74% of the papers have been published in the last 5 years – their contents were likely not incorporated into any medical curriculum.
I am by training and job experience, a statistician, a knowledge engineer, a data scientist and an artificial intelligence practitioner. Early in my careers, I taught high school general science, chemistry and physics at colleges. I have become very interested in this area due to family health challenges.
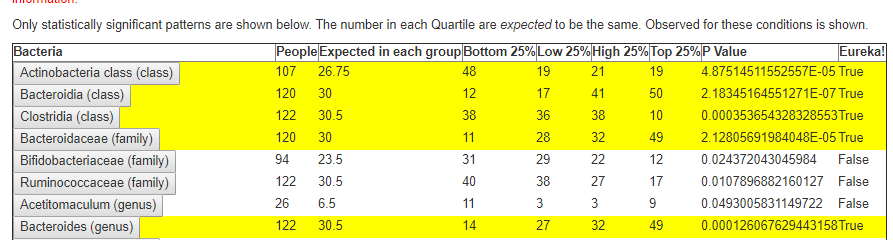
Microbiome having a signature for many conditions
There are many conditions that have found statistically significant bacteria patterns, I have extracted their data (with links to studies) here.
Microbiomes can predict some conditions accurately
This area is under researched — likely because getting good data scientists taking a major pay cut doing medical data is hard with current business offers. Typical statistics taught in medical school are insufficient.
My main interest has been myalgic encephalomyelitis – a condition infamous over 100 symptoms with very few in common between patients. From over 750 donated microbiome samples, some 400 samples were annotated with their symptoms. I tried a variety of statistical approaches and got no where. I then switched to some non-parametric approaches and in May 2019, I shouted Eureka! (but not running thru the streets naked). From these 400 annotated microbiomes, I ended up with 1000’s of statistically significant relationships. For example for the vague “brain fog” we have a few listed below. Some of the relationships were found at the species level.
If a microbiome shift of a specific group of bacteria results in a symptom, then we should test the hypothesis that normalizing this group of bacteria should cause the symptom to reduce or disappear.
No Time for Probiotics!
The urban myth that all that you need is to take probiotics (any type) will fix matters. TOTALLY BOGUS – show me the PubMed studies!!!
Use Antibiotics with caution (if at all)
Experimental protocols for myalgic encephalomyelitis found that certain combinations of long term antibiotics could result in remission for a significant percentage, other antibiotics would make things much worse. We know that antibiotics causes significant changes in some bacteria.
Problem #1:Time to read recent studies
Recent studies, especially veterinary studies, use 16s analysis of the whole microbiome to see what the impacts of various foods, minerals, supplements and spices have on the microbiome. We should create a spread sheet of what food impacts which bacteria and then figure out the optimal combination…. At this point reality hits: we are dealing with 2000+ bacteria taxonomies and 2000+ modifiers… so we may need a spreadsheet with 2000 x 2000 cells. Looking deeper into the studies, we find that different studies on the same combination produced results that disagree, so we may have multiple items in each of these 4,000,000 cells.
Problem #2: What needs to be corrected?
This is actually where most of the current studies fall down badly. Typically the average and standard deviation are computed and no one looks below the cover to see if we are dealing with a bell-curve. The data is rarely ‘normal’. Let us look at values for two taxonomy from the 750 donated microbiome:
Almost 75% of the population has below AVERAGE levels…. think about itOver 75% of the population has below AVERAGE levels
The Problem
We have too many moving parts, too many bacteria, too many modifiers, disagreement between studies, studies results often vague using non quantified expressions “Increased” (by 1% or 500%?)
The Solution
All of the above would be overwhelming to most people. Fortunately, I happen to have the technical quantitative skills and the emotional motivation to tackle this issue – often spending 40+ hr/week working on the solution. The solution is evolving as more data comes in (both studies and samples), and I get creative (I do have multiple patents granted)
In short:
I have created a 58,000 record database of how various items modify the microbiome (each linked to the source study). The Modifiers
This is done by applying text data mining to studies. At present, 14.1 GB of data from PubMed is in the mine, a lot of it is waste.
I have created the ability for people to upload their microbiome and open source the code used. Including the basics of parametric analysis that I used.
I have implemented several algorithms (which are enhanced over time) to determine which bacteria should be the focus. At present the three available are:
Original: based on averages and standard deviations (IHMO a poor choice). This gives the biggest list with likely a lot of false positives. It is still the most common approach that I see used in studies.
BoxPlot: named after a data science method. This gives a much shorter list, it identifies outliers with a non-parametric method.
Symptom-BoxPlot: This matches the statistically significant patterns of symptoms to the microbiome and only attempts to modify those. The goal is to reduce the symptoms. This is the smallest list, and occasionally has nothing.
From the database we then proceed to optimize the choice of modifiers to correct the shift of the selected bacteria. At this point, we are using fuzzy logic and bayesian methods to create weights for items:
Clear Positive – helps with all identified bacteria and no known negative impact on these bacteria
Clear Negative – hurts all identified bacteria and no known positive impact on these bacteria
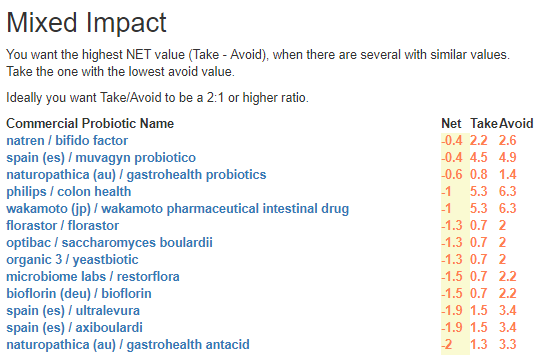
Mixed – helps some and hurts some. The weight can be deceptive because it is a weight of the probability(and not the impact). Care needs to be taken.
Many of the modifiers are specific species of probiotics. Getting single species or strain probiotics is often not possible for most people. As a result, users have entered the contents of probiotics mixtures which allows the same rating as above: Clear Positive/Negative and Mixed
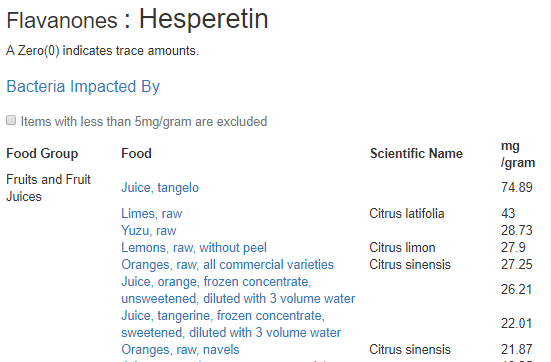
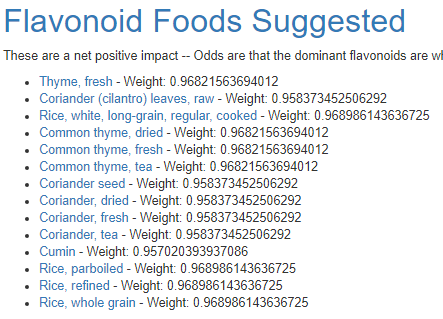
Many of the studies cite flavonoids etc –Often these are greek to the common person. When flavonoids are clear positives, the US Dept of Agriculture resources are used to identify the foods that contains them, and the amount
A typical medical study is done by having two groups, one receives something and the other a placebo. With this system, suggestions being produced are different for each person (and changes over time). One could intentionally tell someone to take the Clear Negative to see if symptoms worsen – but this is immorale (Cause no harm).
As a classically trained scientist, a key factor of any model is the ability to predict. This approach is rich in predictive ability. There have been multiple positive individual reports from users, often with the microbiome test results to validate subjective reports.
Personally, I have seen in family members, Crohn’s Disease with Fistulas improve greatly and not require any prescription for CD for 3 years, nor any more fistulas. Not a remission, but very happy to do regular testing and updates of diets and supplements. There are still some black holes with not clear bacteria associations yet (the number of people reporting conditions are too few and/or comorbid with other conditions) for example, mast cell issues.
This is a difficult path because it is ultra personalized medicine. Explicit to a person and valid for 1-3 months usually. Off label prescription drugs can come into play because they do modify bacteria (examples here).
How long before it is accepted by Main Stream Medicine?
Given that it took decades for H. Pylori to be accepted as the cause of ulcers, I do not expect it to be soon. The usual promoters for medical change, pharmaceutical companies, have no profit in this approach. If I (a seasoned software developer/architect who worked for startups), asked how much do I need to properly commercialize this (including double checking data, increasing samples and meta data), I would say between $5 million and $20 million dollars for starters.
What we have is a citizen science implementation that uses a lot of duct tape and bailing wire. Some medical professionals are using it as one of several inputs for their patients.
Some Snapshots of features:
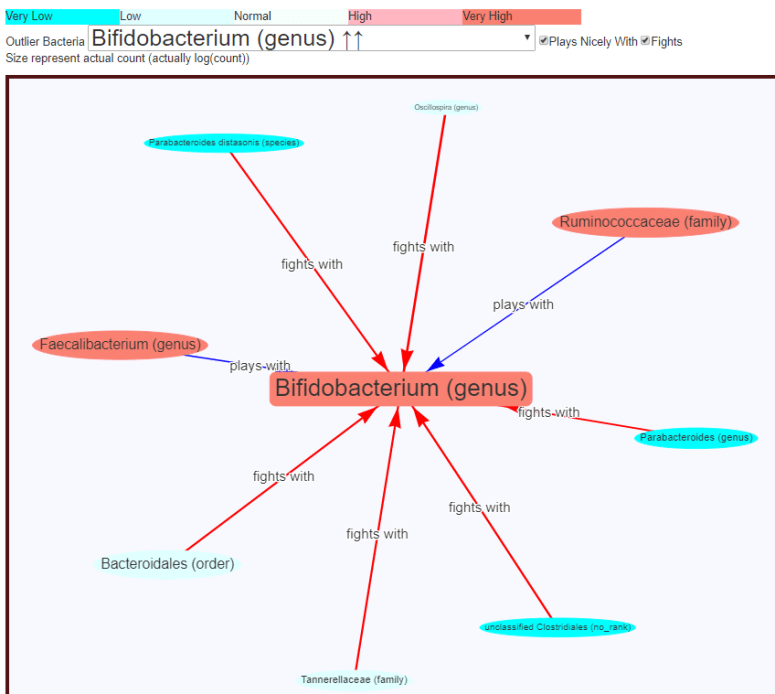
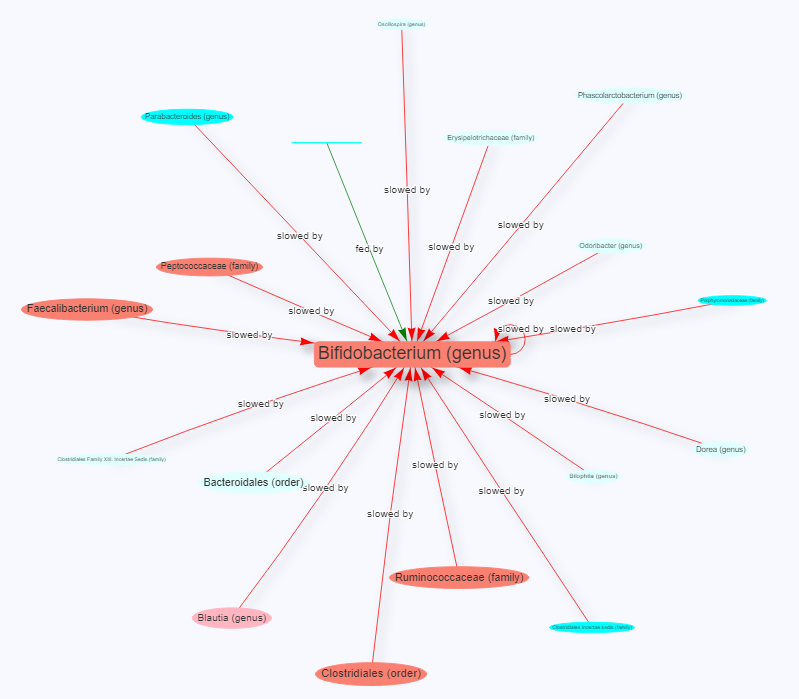
The chart below shows interactions obtained from the 750 samples using non-parametric methods. The thickness of the line increases the strength of the interactions, the size of the oval indicates the amount of each bacteria in an individual sample (this sample had 6% being Bifidobacterium — placing it at the 79%ile in the samples) .
This next diagram is based on medical literature summarized by Peter D’Adamo. The lines are all the same thickness because the degree of impact is not known.
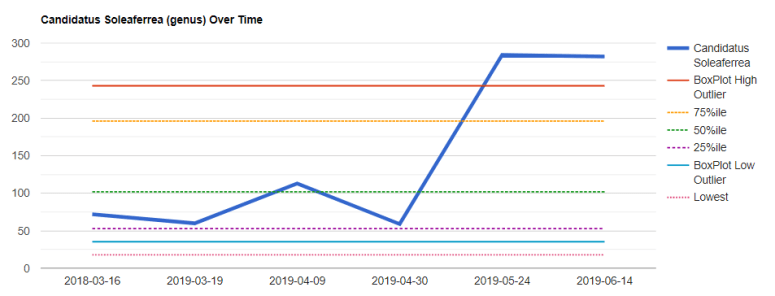
The next chart shows percentile levels and is far better to see if a shift is significant. Note that average is intentionally left off. Selecting what to inspect as a chart was simple, look at the box-plot outlier bacteria list.
Bottom Line
The site starts with a hypothesis and runs with it logically. There are some assumptions made in the processing, often the choice is driven by a bayesian computation to pick the most probable option. It attempts to be totally open on how it comes to conclusions (and readers have caught a couple of data entry errors because of this openness).
From the literature on risk evaluation and professionals, I believe that the suggestions generated will perform better then suggestions from most medical professionals. The system is still evolving (and with open sourcing it, being refactored and minor issues corrected).
A reader sent me a new GI test results as a PDF today. Since I have just converted the XenoGene (Spain) PDF report into an automatic report, my initial thought was — let us convert this one….
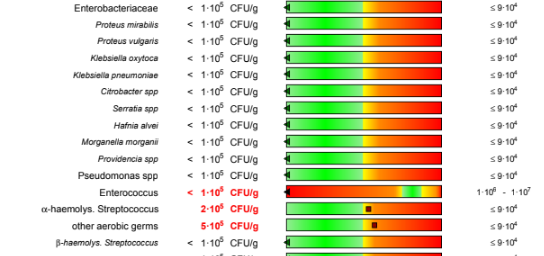
Brakes applied…. I noticed the units of measurement: Community Forming Unit/gram
This is not the same unit of measurement as uBiome, American Gut, Thryve, XenoGene and other 16s tests. Those tests are the percentage of the total CFU.
In the colon, bacterial concentrations of 10(11)-10(12) cfu/g faeces are found. [1982] In other words, a 10x variation in CFU/g.
The second item is simple Colony Forming Unit — means counting the bacteria that grows on a sample plate or in a test tube. Not all will grow at the same rate — thus the numbers are post cultivation. 16s Samples do not require cultivation and thus are far closer to the numbers actually in the sample.
So, bottom line: you cannot compare results between these two types of tests — even when done on the same sample! For example, in the above test we see normal for Enterobacteriaceae as being < 9 10(4) CFU/gram. Checking on our uploaded samples for Enterobacteriaceae, we see the average is 10%, but less than 25% of samples are over 5%. Using the lower of the reported ranges: 9×10(4)/10(11) we find that the above test translates to: 0.00009%. Using the higher value.. 0.000009% . That’s a difference of 55,555x!!!!
Are the CFU/gm numbs wrong? NO, they are correct for the process that the lab is using BUT THIS IS NOT THE ACTUAL AMOUNT, it is the count after cultivation.
This is not an apple-to-oranges situation. It is an apple-to-walnuts (perhaps watermelons-to-mustard-seed).
The Other Labs Page ( http://microbiomeprescription.com/Labs ) does not capture the same numbers as ubiome, thryve, xenogene, american or british gut. It asks the user to enter green, yellow, red equivalency from the received reports. It also assumes that the labs are correct with their ranges and coding.
Personally, I doubt their ranges, they look so very very much like what you would get using averages and standard deviations. A methodology that I do not think apply to microbiome samples (as shown above for Enterobacteriaceae )
Bottom Line
If we are talking about an overgrowth of one or two bacteria, then the older cultivated lab tests are adequate. If we are talking about a complex shift of microbiome then we really (IMHO) need to use 16s tests (XenoGene, Ubiome, Thryve, American or British Gut). From these tests, we can see the complex relationship between bacteria as shown below (the Why? Citizen Science, and Why? charts)
Hello Ken,Your work is fantastic and continually raises the bar regarding the microbiome.This week I received my 3rd ubiome result over the span of approx 12 months.Prior to the most recent sample I followed the top few dietary suggestions based on my previous sample such as red wine, navy beans, thyme, red meat.Bifido has jumped to over 6% (although this may have been caused by massive amount of dark choc, up to 150 grams per day).In any event, overall the gut bacteria don’t appear to have significantly shifted and remain in a state of dysbiosis from what I can understand.Have you ever considered that perhaps the microbiome may be an outcome of an underlying issue? For instance I just received a hair tissue mineral analysis which revealed significant copper toxicity and some outcomes of copper toxicity include yeast, bacterial overgrowth, adrenal fatigue, etc.
Goal of this Post
For myself, I have seen the appearance that suggestions has been improving my own microbiome. The key word is appearance. The changes could be coincidental, placebo effects etc. For me, there is a sharp logic behind the suggestions; alternative approaches are based too often on hearsay.
So, in this post, I am going to review his results over time, also check if the recommendations have evolved from adding more data.
Items that lacked sufficient data to include in the analysis:
Metabolism for each report
Symptoms for each report
At a high level, we see no changes in summary template numbers over the time period,
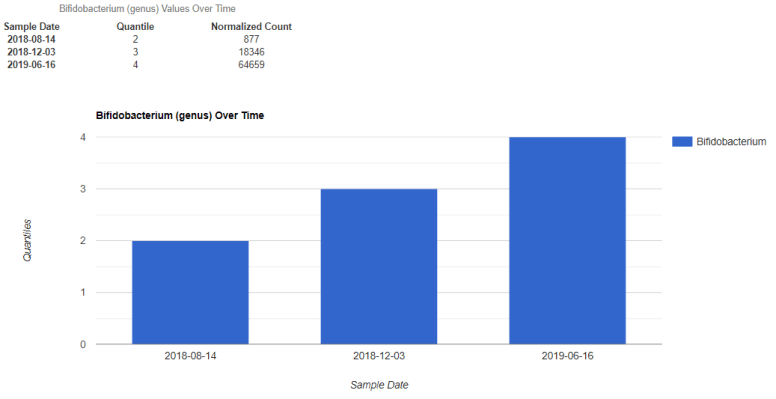
Bifidobacterium – in the highest 25%!
But LACTOBACILLUS is still at zero
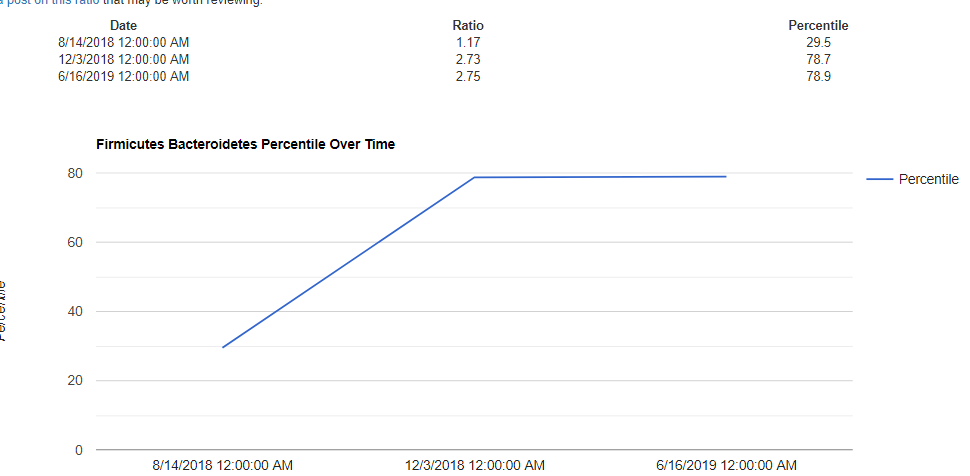
Firmicutes/Bacteroidetes Ration went from 30%ile to 79%
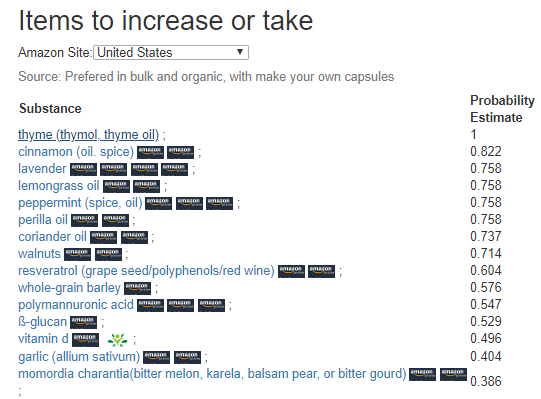
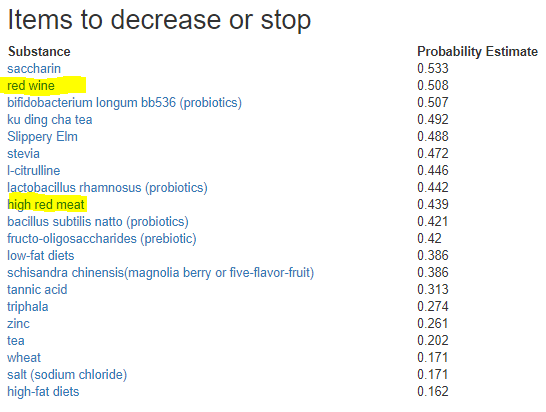
Revisiting Suggestions for 1st Sample
Since symptoms were not available, I picked the outlier option (which did not exist a year ago) and got some results that may explain the slow progress aka poor suggestions:
On first SampleOn first sample
Red wine and resveratrol are an interesting pair — usually the impact of the red wine is ascribed to resveratrol. There are other things in red wine, like tannic acid. When one shows up on the positive list and one on the negative list — it becomes a judgement call. My usual response when there is an apparent conflict is to not do either. The weight numbers are based on number of studies and not impact.
The reader also supplied mineral analysis with only copper appearing abnormal, but zinc was the third highest value (but in normal range).
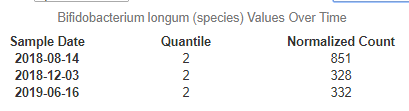
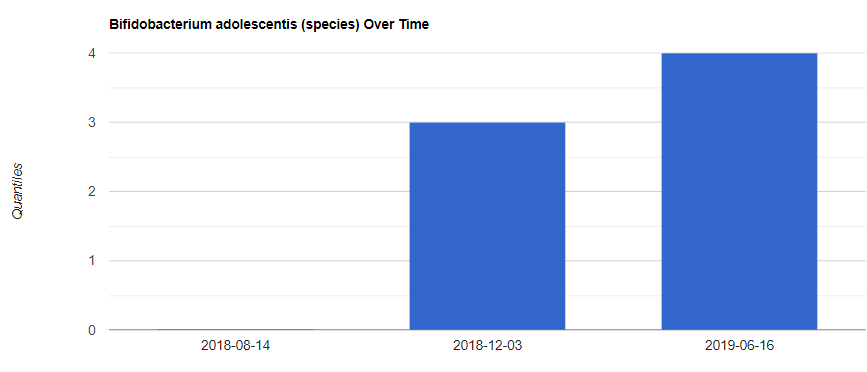
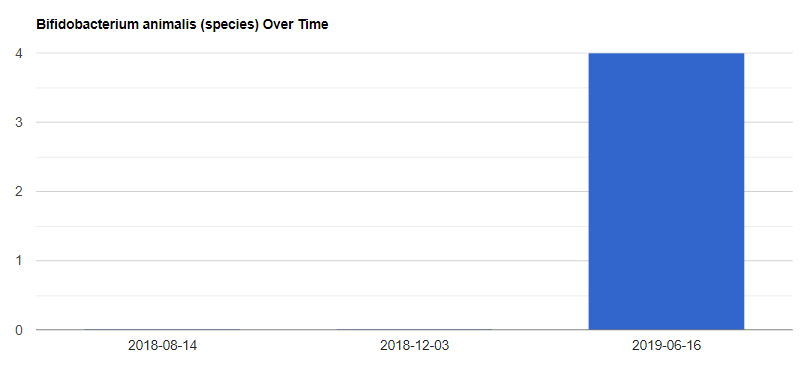
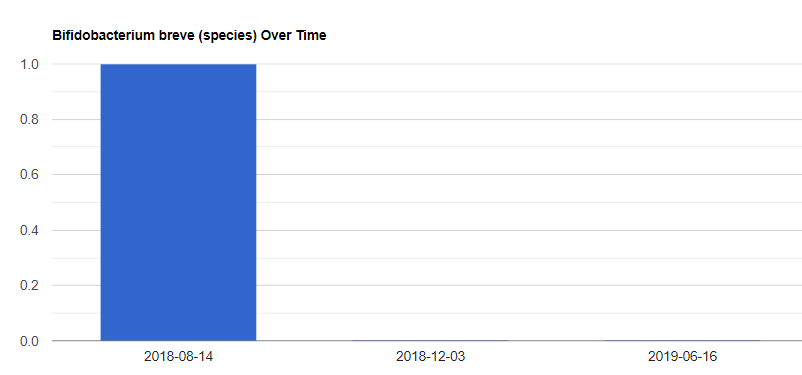
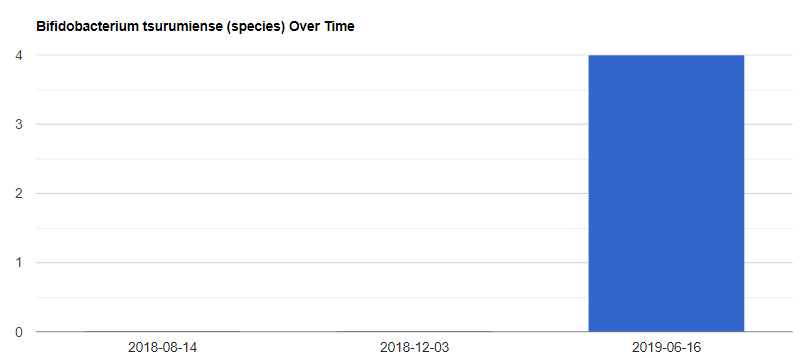
Looking at Bifidobacterium deeper
It was interesting to see that Bifidobacterium longum was on the avoid list. So I decided to see his amounts and see that this one did decrease (while all Bifidobacterium increased)
We also see these changes:
Bottom Line
Come back often to check your suggestions must be emphasised. New data is constantly being added and the algorithms are being tuned.
Followup comments from reader
Some great insights. I will endeavour to make greater use of your site over next few days by adding more detail surrounding symptoms, etc. Prior to my first sample I had been eating primarily plant based with high carb diet, lots of rice, oats, starchy root veg and low fat milk. Very minimal animal protein at that time. Prior to most recent sample I had incorporated some of the suggestions daily such as red meat, navy bean, lots of dried thyme and herbs, cinnamon, red wine, etc.
As for the bifido increase, again I really believe it was large doses of 90% dark choc that caused this. Knowledge gained from your site!
Try to remember to enter your metabolism numbers from uBiome and your symptoms. Symptoms are now an option in building suggestions and are the most likely path to obtain observable results.
New Features to consider incorporating
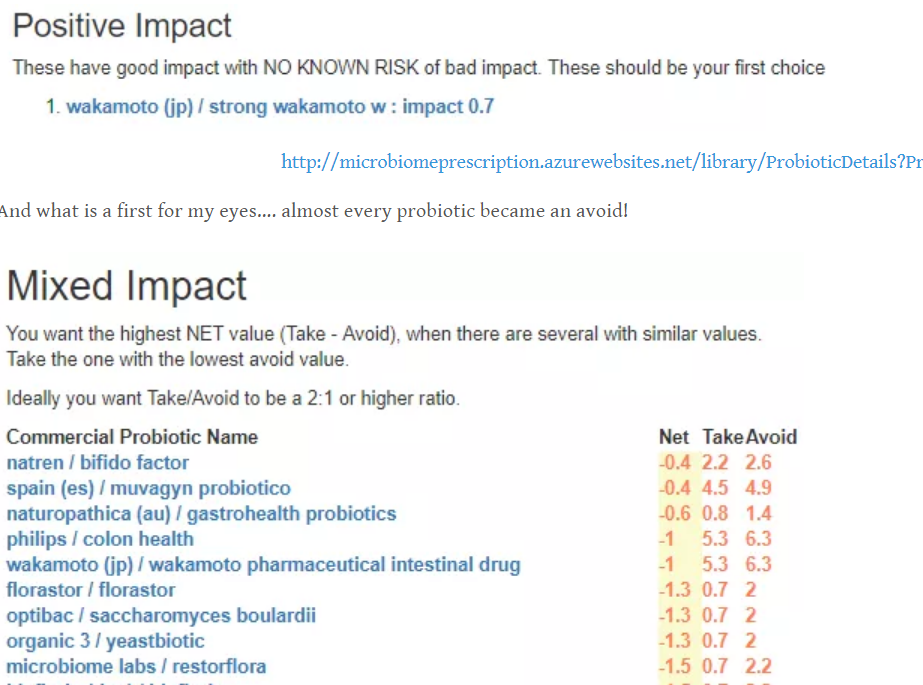
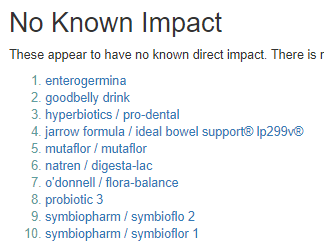
Commercial probiotics are now explicitly included in the suggestions. Of the 166 products entered, only a single one was suggested (which can be obtained on Amazon and elsewhere).
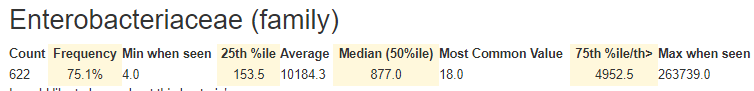
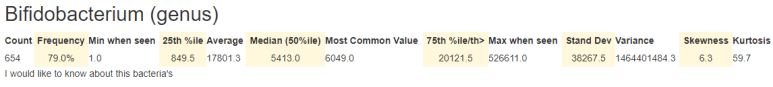
As a by-product of open-sourcing (and refactoring) my site, I have improved the bacteria details page by adding a table on core statistics as shown below. For this example I picked Bifidobacterium since that it a concern for many people and also illustrated some problems using averages.
Old Page headerUpdated Header with more statistics.
The first shock (to many of you) may be that the average was 17,800. WAIT – 50% of the people are only at 5413. In fact, only the highest 25% will have values at or above the average. If we do the usual 2 standard deviation for ‘normal range’ using these statistics, our range is 0 – 94,000. Thus people with zero bifidobacterium are in the normal range!.
Bottom Line
The numbers are there, you may need to acquire some knowledge about interpreting these numbers. You also need to stop thinking of bacteria behaving like a bell-curve/normal distribution.