
This year we saw a considerable increase in the number of studies published on the microbiome, especially those done using 16S ribosomal RNA (16S rRNA) gene sequencing (for example uBiome.com). The 16S rRNA gene is relatively short at 1.5 kb, making it faster and cheaper to sequence than many other unique bacterial genes, and is found in all bacteria. RNA is similar to DNA — providing a unique identifier. [source]. It is the most reliable way of identifying bacteria. Earlier methods can be compared to looking at a person’s hair color, build, eye color etc to determine which ethnic group they are. Visual examination(for example with dark field microscopes) cannot tell if they are good or bad strains. 16S rRNA can identified almost exactly what they are — but whether they are bad or good species or strains is unknown until studies can be done.
- “Overall, between 16S gene based and clinical identities, our study shows a genus-level concordance rate of 96% and a species-level concordance[agreement] rate of 87.5%. We point to multiple cases of probable clinical misidentification with traditional culture based identification across a wide range of gram-negative rods and gram-positive cocci as well as common gram-negative cocci.” [2015] i.e. 1 in 8 species were incorrectly identified by visual examination.
Looking at a human, we knew in 2008, that there was over 5,600 separate species or strains [source].
The key question is what is a normal microbiome. The microbiome is associated to a person DNA. So the question becomes — what is “normal DNA”? Someone with blonde hair? Brown eyes? Freckles? High caffeine metabolism? DNA is further complicated by epigenetics (changes in organisms caused by modification of gene expression rather than alteration of the genetic code itself).
This is further complicated for the microbiome by diet. So what is normal?
If you are in Copenhagen, then you may easily conclude that a tall, blonde, white, blue-eye, slim person is normal. If this “normal” person is dropped in a small village in Ethiopia they are abnormal. Their microbiome will likely be even more abnormal — comparing a frequent fish and meat eater to a subsistence villager.
CFS Microbiome
The original report on finding a shift in CFS patients dates from 1998 in Australia. One of the gotcha in comparing microbiomes of CFS patients to controls is diet. CFS has a high incidence of IBS which will result in diet changes for the CFS patient compared to controls. So do we definitely know the changes are due to CFS and not a response to the shift of diet from IBS? The answer is no, it is the most probable cause and the simplest explanations of all of the observations.
In my last post, I found there has been no published studies on the use of baking soda/sodium bicarbonate supplementation or l-arginine supplementation with CFS/IBS/FM. Nothing!
When we move to the microbiome, we have even less know information. Many studies have been done not with specific strains (gold standard), or even species (containing dozens of strains — each different) but at the family level (containing hundreds of strains!!).
Every day in my work life, I deal with statistics and see problems dealing with “naive understanding”. The greatest problem is using an average — average is good only if the distribution of data has been shown to be “normal”.
Lab Ranges
Normal laboratory certification require that each test be validated against a local group of normal individuals. the high and low values are typically at the lowest 1-5% and the highest 1-5% (i.e. 2-10% of normal people will be out of range!) [reference]. In some cases, naive oversimplification happens — for example: body temperature — a high temperature indicate sickness/infection … and only a high temperature!
Looking at a recent study (image below) and finding 5%-95%ile, we find reality is different (and MDs working of ancient oral traditions!) . A temperature of 99.5 is outside of the normal range!
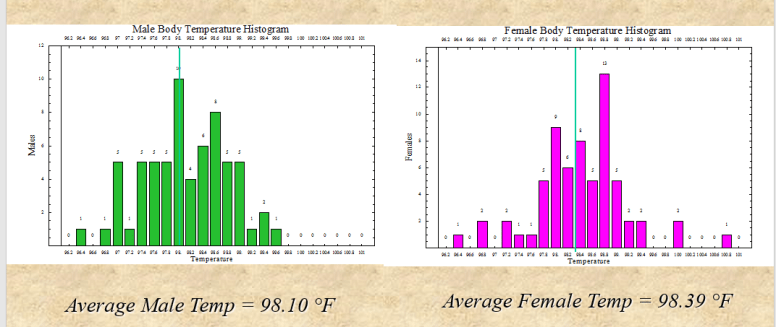
- Male: 97F – 99F
- Female: 97.4F – 99.2F
In dealing with statistics at work, I have encountered cases where the average is 250, the 50%ile (half of the values are above or below) of 80. A value of 250 was actually abnormal and occurred only 2% of the time!
The source for 98.6F is from a European study finding that the average temperature was 37C (from 97.7F to 99.5F) which was literally translated and made 3 times more accurate in translation than the original stated.
Issue with uBiome results
Care must be taken on two fronts:
- Results are given as a ratio against the average. This may or may not be significant, that is the numbers that may look extreme can actually be inside the normal range.
- We are often dealing with families that are optional – not occurring in all individuals.
- The ranges are one sided.
I have written my contacts at uBiome to see if we can get better statistics.
Another Reader Lab Results
A reader forward results from RedLabs.be. The results are very similar to those from uBiome.com
Red Lab Microbiome Results
One of the tables sent, is shown below indicated 4 abnormal results. Looking at the Genus post for each of these, we see ‘reference values’ which are unfortunately one-way.
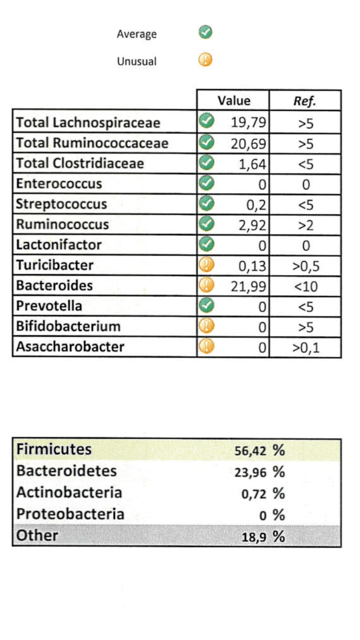
- Turicibacter was below 0.5 in 9/12 reports — but had an average of 0.54 (due to one having a high value)
- Bacteroides was below 10 in every report – this high value appears to be an abnormal result for CFS
- Bifidobacterium was below 5 in every report – this matches the CFS profile
- Asaccharobacter (Coriobacterinease) was not reported in any report – this matches the CFS profile
Another table indicated
- Eubacterium — which is normally not expected to be found by the lab, was found, this also occurred in 5/12 reports. This suggests, that it may be a subset indicator.
On the other hand, this seems at odds with the literature “In the human intestinal tract, Eubacterium is the second most common genus after the genus Bacteroides and is more common than the genus Bifidobacterium ” [2000], table below:

As you can see above — there is a major difference between studies. One study had 94% (11/12) positive for E.hadfrum and another study had 0% (o/141). In short, we really do not know what is normal. If E. hadfrum a regional or ethnical associated species of Eurbacterium?
Similarly, Escherichia was deemed normal because the test results was ZERO and the reference range was < 0.5. Again, the literature suggests that is not the case “E. coli is used as an indicator is due to a significant larger amount of E. coli in human feces than other bacterial organisms.” [source]
Bottom Line for Microbiome tests
The problem with the existing microbiome tests is the absence of use of local reference populations – especially with reference to diet and DNA. The main issue is over analysis of any results… especially at the individual level. A large sample reduces the amount of noise cause by these factors and reveal general patterns.
The patterns are general and it is unlikely we will see supportable fine tuning. We can easily become saturated with too much information — most of which, we do not know either how to interpret or what to do if we can interpret!!
Bottom Line for patient
The reader’s microbiome fits the general pattern for CFS except for the high level of bacteroides. Bacteroides are not available as probiotics – so we can exclude that explanation immediately. Dr. Myhill see low level of bacteroides in her patients.
Looking at the typical distribution of bacterioides species [2007] and my recent post on IBS/IBD where B.fragilis figure prominently, I suspect IBS, possibly UC and even Crohn’s disease may occur over time. In that same post, I suggested discussing with your medical professional about taking one or more courses of metronidazole,
Otherwise, the reader follows the typical pattern
