
I have updated the page to stop using averages (which can be very misleading for bacteria populations) and move to the box-plot approach to identify outliers (atypical values). End product is experimental because we do not have a good reference source for what each bacteria produces. We know some of them, but not all. Also, different strains produce different amounts adds to the uncertainty.
After you log on, you will see a new button by each sample:

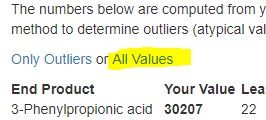
The initial report show only the odd numbers. In the case very below, we have 3 end products that are high.

Clicking on All Values, will show some 100 end products.
For example, I want to see how histamines and hydrogen sulphide changed over time with the ME flare.


Bottom Line
This is experimental. For myself, the end product levels computed for hydrogen sulfide appear to match my symptoms.
The last column is the number of samples that had a value for the end product. The user may have this end product but it is being produced by a bacteria that is not in our database as a producer…. hence experimental.
