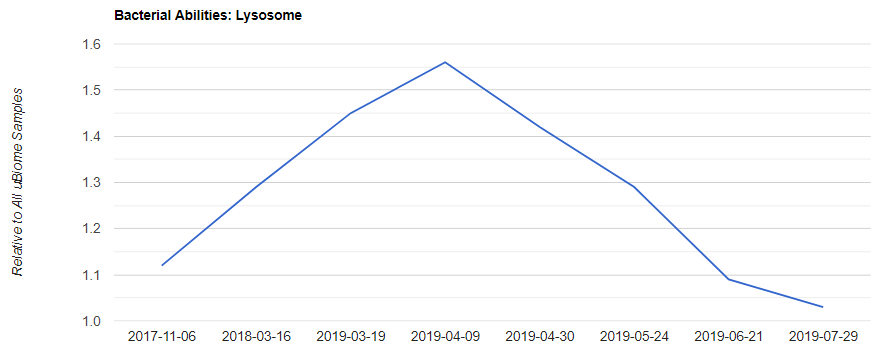
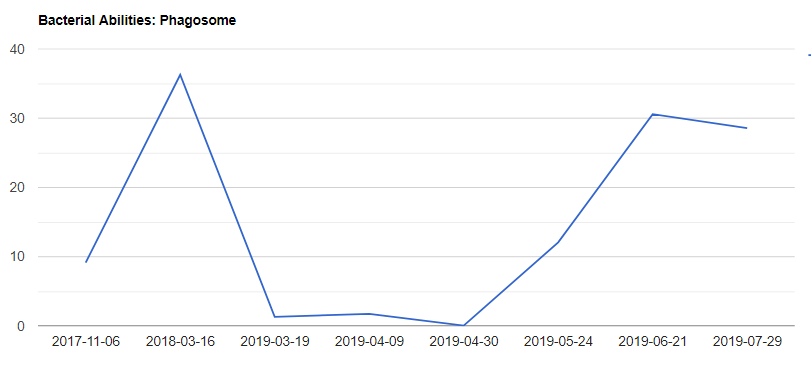
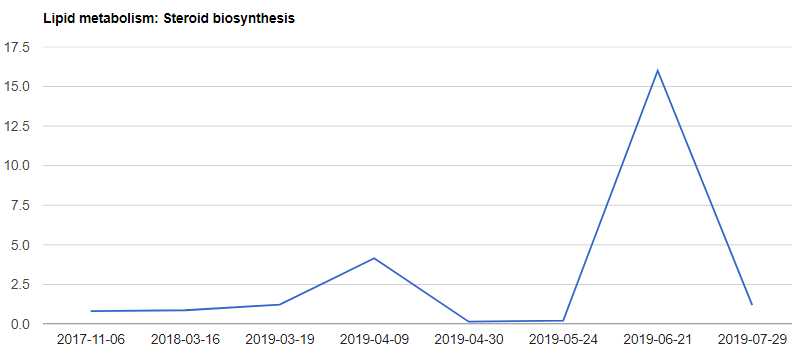
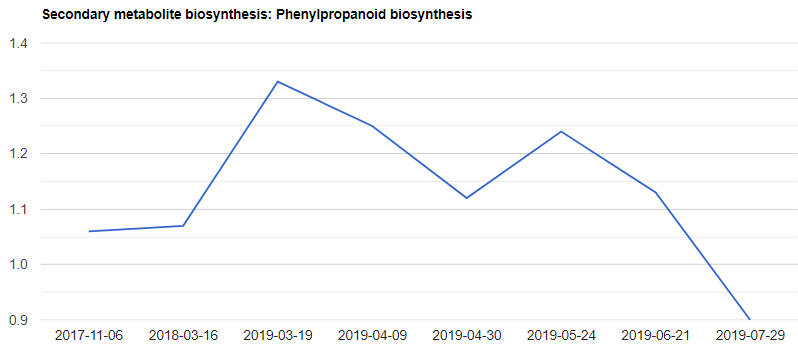
Since the original #6 report, I have entered from the uBiome site, the predicted metabolic function values for my samples (in the new entry form) and coded up a timeline view. It has been pushed to the site. NOTE: This comes from the uBiome site and is not available from other 16s test providers. There are 105 different functions reported by uBiome.
To get the charts you must TRANSCRIBE the data from ubiome. Otherwise you will see nothing. See this post.
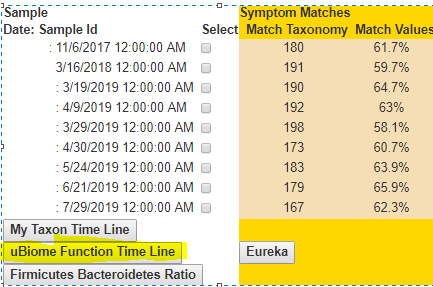
This post looks at the most interesting charts. The 2017/2018 values are PRE-RELAPSE and show the normal values for me.