CFS/FM/IBS Metabolism deep dives — Fundamentals

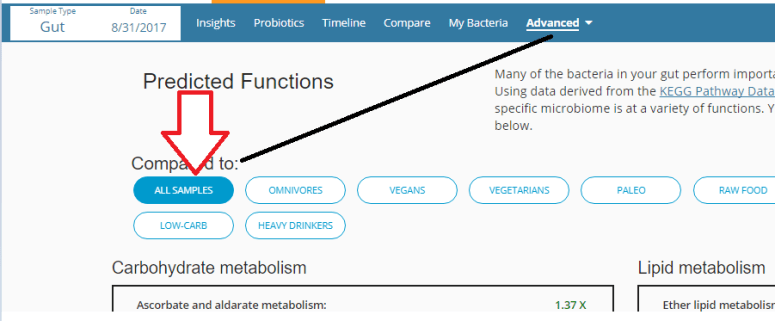
On the ubiome function/metabolism report there are several different terms being used which I wish to try to give definition/explanation for the brain-fogged. See this post on how you can contribute to this data

The most important and common are the three shown below.

Metabolism

This means the conversion of a named item into different parts and the parts being reassemble back to the named item.  This of oxygen and carbon dioxide: plants converts carbon dioxide to oxygen, humans convert oxygen to carbon dioxide.

  • If the value is 0.8 – 1.2 , you are naturally producing a normal flow of this item
  • If the value is below 0.8. the flow is reduced. Some if the different parts may be too high or too low (think of baking a cake — too much flour and not enough eggs — if one is out  of step then things are not right).
  • If the value is over 1.2, you may have greater than normal flow. Some if the different parts may be too high or too low (think of baking a cake — too much flour and not enough eggs — if one is out  of step then things are not right).

Needless to say — this gets complex because we are not told the details.

More literature:

Degradation

AKA biodegradation. This means the ability to breakdown specific items into component parts. We can think of this as the ability to clear items from your body.

Low values suggests excessive accumulation. High values may result in being short of this item because it is aggressively removed.

More literature

Biosynthesis

This means that the named item is being produced from the various bacteria from simple chemicals you have.

  • If the value is 0.8 – 1.2 , you are naturally producing a normal amount of this item
  • If the value is below 0.8. supplementation (if available) would be suggested
  • If the value is over 1.2, you may be over-producing this items and may wish to:
    • Eliminate it from supplements or foods rich in it
    • Reduce the bacteria that is producing it (if known)
    • Encourage consumers.

Both High and Low would be expected to cause symptoms.

More literature:

Deep Dives in Metabolism

The following will be the target of subsequent posts (which will be linked to as they are written)

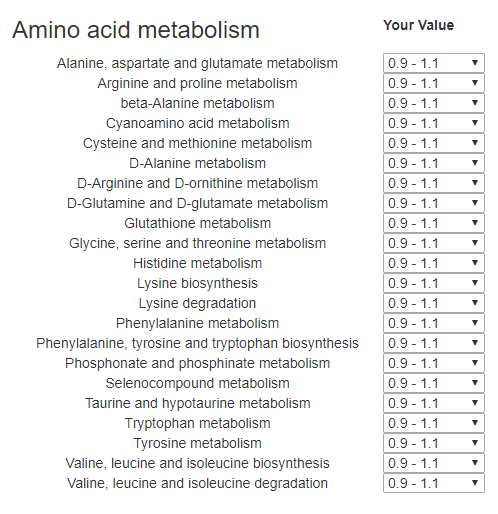
Amino acid metabolism

  1. AverageAlanine, aspartate and glutamate metabolism
  2. Arginine and proline metabolism
  3. beta-Alanine metabolism
  4. Cyanoamino acid metabolism
  5. Cysteine and methionine metabolism
  6. D-Alanine metabolism
  7. D-Arginine and D-ornithine metabolism
    1. Low
    2. Take Ornithine, Arginine (with Lysine), Zinc, glutamine
  8. D-Glutamine and D-glutamate metabolism
  9. Glutathione metabolism
  10. Glycine, serine and threonine metabolism
  11. Histidine metabolism
  12. Lysine biosynthesis
  13. Lysine degradation
  14. Phenylalanine metabolism
  15. Phenylalanine, tyrosine and tryptophan biosynthesis
  16. Phosphonate and phosphinate metabolism
  17. Selenocompound metabolism
  18. Taurine and hypotaurine metabolism
  19. Tryptophan metabolism
  20. Tyrosine metabolism
  21. Valine, leucine and isoleucine biosynthesis
  22. Valine, leucine and isoleucine degradation

Bacterial Abilities

  1. AverageBacterial chemotaxis
  2. Bacterial motility proteins
  3. Bacterial secretion system
  4. beta-Lactam resistance
  5. Cell division
  6. Cell motility and secretion
  7. Flagellar assembly
  8. Lysosome
  9. Phagosome
  10. Sporulation

Carbohydrate metabolism

  1. AverageAmino sugar and nucleotide sugar metabolism
  2. Ascorbate and aldarate metabolism
  3. Butanoate metabolism
  4. C5-Branched dibasic acid metabolism
  5. Citrate cycle (TCA cycle)
  6. Fructose and mannose metabolism
  7. Galactose metabolism
  8. Glycolysis / Gluconeogenesis
  9. Glyoxylate and dicarboxylate metabolism
  10. Inositol phosphate metabolism
  11. Pentose and glucuronate interconversions
  12. Pentose phosphate pathway
  13. Propanoate metabolism
  14. Pyruvate metabolism
  15. Starch and sucrose metabolism

Lipid metabolism

  1. Averagealpha-Linolenic acid metabolism
  2. Arachidonic acid metabolism
  3. Biosynthesis of unsaturated fatty acids
  4. Ether lipid metabolism
  5. Fatty acid biosynthesis
  6. Glycerolipid metabolism
  7. Glycerophospholipid metabolism
  8. Linoleic acid metabolism
  9. Sphingolipid metabolism
  10. Steroid biosynthesis
  11. Steroid hormone biosynthesis
  12. Synthesis and degradation of ketone bodies

Secondary metabolite biosynthesis

  1. Average Betalain biosynthesis
  2. Butirosin and neomycin biosynthesis
  3. Caffeine metabolism
  4. Flavone and flavonol biosynthesis
  5. Flavonoid biosynthesis
  6. Indole alkaloid biosynthesis
  7. Isoquinoline alkaloid biosynthesis
  8. Novobiocin biosynthesis
  9. Penicillin and cephalosporin biosynthesis
  10. Phenylpropanoid biosynthesis
  11. Stilbenoid, diarylheptanoid and gingerol biosynthesis 
    1. HIGH
    2. Take Ginger, Turmeric, Resveratrol, Almonds
  12. Streptomycin biosynthesis
  13. Tropane, piperidine and pyridine alkaloid biosynthesis

Secondary metabolite degradation

  1. AverageAminobenzoate degradation
  2. Atrazine degradation
  3. Benzoate degradation
  4. Bisphenol degradation
  5. Caprolactam degradation
  6. Chloroalkane and chloroalkene degradation
  7. Chlorocyclohexane and chlorobenzene degradation
  8. Dioxin degradation
    1. LOW and deteriorate over time.
    2. Take Activated Charcoal, Resveratrol
  9. Drug metabolism – cytochrome P450
  10. Drug metabolism – other enzymes
  11. Ethylbenzene degradation
  12. Fluorobenzoate degradation
  13. Metabolism of xenobiotics by cytochrome P450
  14. Naphthalene degradation
  15. Nitrotoluene degradation
  16. Polycyclic aromatic hydrocarbon degradation
  17. Styrene degradation
  18. Toluene degradation
  19. Xylene degradation

Vitamin metabolism

  1. AverageBiotin metabolism
  2. Folate biosynthesis
  3. Lipoic acid metabolism
  4. Nicotinate and nicotinamide metabolism
  5. One carbon pool by folate
  6. Pantothenate and CoA biosynthesis
  7. Porphyrin and chlorophyll metabolism
  8. Retinol metabolism
  9. Riboflavin metabolism
  10. Thiamine metabolism
  11. Ubiquinone and other terpenoid-quinone biosynthesis
  12. Vitamin B6 metabolism


Five people have added their…

Five people have added their metabolite profile from uBiome to their data.
http://microbiomeprescription.com/Metabolite/explorer

One item sticks out greatly — very low D-Arginine and D-ornithine metabolism for all five.
If you happen to have any readings on treating D-Arginine and D-ornithine metabolism , please forward to me.
My initial take is that means that D-arginine and D-ornithine does not get processed much resulting in a build up. This suggests a low arginine and low ornithine diet could be considered.
“Some of the best choices are soybeans, pumpkin seeds, sesame seeds, peanuts and walnuts. You’ll also get it from sweet green peppers and the seaweed spirulina. Grains such as quinoa, oats and wheat germ deliver arginine, as do a variety of ready-to-eat cereals made from oats, rice and wheat.” https://www.livestrong.com/article/275892-foods-high-in-l-arginine/

I need to do more digging, but hope some of you have already done it and are willing to share!

Kegg Pathway – Metabolism and Microbiome

I have just created a new set of pages to allow people who have done uBiome to share the metabolism information that is also provided there.  I put my own and a friend’s thru and was struck by the differences. Almost all of mine was sitting at .95 – 1.05 of normal. Many of her’s were sitting at 0.03, 0.05 of normal.

Short Explanation

Bacteria have a large number of interactions and behaviors. There is a site where this information has been gathered, KEGG PATHWAY Database. uBiome has used this site with your bacteria sample to predict/estimate how well various pathways are working with your current bacteria mixture.

You will find this information under [Advance] on your uBiome page

meta

There is no ability to download and upload it at present. The items are arrange from highest to lowest value.

I have created an entry page (AFTER YOU LOGIN and pick the sample) at: http://ubiomecfsweb.azurewebsites.net/Metabolite/metabolismEntry

The page is shown below. I have chunked ranges together to make entry easier.

meta2

In general, we are concerned about low values. What the values means and what you can do about them will be covered in later posts when we get data.

Examples:

  • A low “Ubiquinone and other terpenoid-quinone biosynthesis” means that your bacteria under produces Ubiquinone (a.k.a. CoQ10) and thus you should be supplementing with it — perhaps in higher dosages than usual.
  • A low “Styrene degradation” means that you may need to really avoid items with even trace amount styrene, in fact, “The U.S. Environmental Protection Agency (EPA) has described styrene to be “a suspected toxin to the gastrointestinal tract, kidney, and respiratory system, among others”.[29][30] ” which may be a contributing factor for IBS
  • A low “Retinol metabolism” (Vitamin A),  means it takes longer for the body to use it. In some cases if it is water borne, then you may urinate it out unprocessed and have little effect from a normal dosage.

I will likely do deep dives into these — every 5 sets submitted will result in the lowest common values seen being the next deep dive.

A video

For more videos, go to this page.

Bottom Line

Adding metabolites WITH symptoms may help discover association between chemical sensitivity and the metabolic functioning, etc.  We need uBiomes, symptoms and metabolites to obtain a rich set of data to identify symptoms to both bacteria and to metabolites (i.e. hints to the specific supplements that may help you!)

I have also stubbed out a symptoms to metabolite explorer page.

GENDER AND AGE Has Been Added to Symptoms

If you have entered symptoms, please update it with your gender and age.

Just fixed a bug on…

Just fixed a bug on the Reference pages. Please recheck any exploration by specific bacteria you did.

This did NOT impact the Recommendation pages.
http://microbiomeprescription.com/Library/Detail/?high=0&taxon=1678

IBS/CFS/Long Covid Insight from Bergen’s Giardia Infection

I have been following the 2004 Giardia infection population studies because it is a good size population with a laboratory-confirmed root cause of CFS and IBS for the patients in the population. It is a reference case for Post Infection Syndromes. The 10 year report has just be published on PubMed Prevalence of Irritable Bowel Syndrome and Chronic Fatigue 10 Years after Giardia Infection [2018].

“In 2004, the drinking water source in Bergen, Svartediket, was infected by the Giardia lamblia parasite. At least 2,500 people suffered from diarrhoea and abdominal pains as a result. Many have struggled with abdominal complaints and fatigue since then, results from the follow-up studies show.” [2015]

My model is that some event (infection often) result in a shift of the microbiome which did not return to the prior state within 6 months (diagnostic definition for CFS).  In this case, we have a specific known event (instead of “some event”) and can see something about the life cycles of CFS/IBS/LC given the large number of patients with the same initial event at the same time. This is a unique population significant for understanding LC, CFS and IBS behaviors.

The numbers below come from different authors who sometimes did different samples and criteria. 😦

For CFS (remember CFS diagnosis require 6+ months. Fukuda et al’s 1994 criteria was used)

  • in 1-3 years: 60%
  • After three years: 46.1%
  • After five years: 41.5%
  • After six years: 30.8%
  • After ten years: 26%

For IBS (Rome II criteria):

  • After one year: 43%
  • After three years: 46.1%
  • After three years: 46.1%
  • After five years: 59.6%
  • After six years: 39.4%
  • After ten years: 40%

Irritable bowel syndrome and chronic fatigue 3 years after acute giardiasis: historic cohort study. [2012]

Chronic fatigue syndrome 5 years after giardiasis: differential diagnoses, characteristics and natural course [2013]

Irritable bowel syndrome and chronic fatigue 6 years after giardia infection: a controlled prospective cohort study. [2014]

  • “Lactulose-induced hydrogen breath excretion was not significantly different in patients and controls.” [2006]
  • “Exposure to Giardia infection was associated with perceived food intolerance 3 years after giardiasisIBS status did not alter the association between exposure status and perceived food intolerance. Perceived intolerance to high FODMAP foods and low FODMAP foods were both statistically significantly associated with exposure to Giardia infection.” [2015]
  • “A total of 58 (60%) out of 96 patients with long-lasting post-infectious fatigue after laboratory confirmed giardiasis were diagnosed with CFS.” [2012]

Bottom Line

“CFS has been reported to affect 10% following Epstein Barr virus (EBV) infection [4,5], and fatigue, depression and hair loss is a common syndrome following Dengue fever [6,7]. In controlled studies chronic fatigue has been reported after Lyme borreliosis [8], Parvovirus B19 infection [9], Q fever [10] and Ross River virus infection [4].”  [2013]

Doing some math, for natural recovery

  • At 1-3 years: ~ 9% recovered from CFS per year
  • At 3-6 years: ~ 13% recover from CFS per year
  • At 6-10 years: ~ 4.2% recover from CFS per year

In short, the longer the dysfunction continues, the more stable it becomes — thus the harder to undo.

IMPORTANT — Natural recovery is cited above

That is doing nothing, or a variety of ad hoc things.

See https://cfsremission.wordpress.com/2016/03/12/ibs-probiotics/ for probiotics that have had demonstrated effective for IBS in studies.