Red Blood Cells and CFS

The question of red blood cell (Erythrocytes) came up on my local Seattle CFS Group and I thought it would be good to summarize what we know in this area.

  • Reduced red cell distribution width

    • Note: Increased red cell distribution width in IBS and active IBD
  • Increased percentages of misshapen red blood cells
  • Percentage of deformed cells reduced with B12 injections within 24 hrs in responders [source]
  • Morning blood sample can be normal and the afternoon sample can be grossly abnormal
  • B12 injections improved blood appearance in 50% of patients
  • Changed red cell shape populations.
  • High values for flat blood-cells.
  • Reduced Red Blood Cell Volume [Bell]

For more reading see Red-Blood Distribution Width on PubMed.

Low Oxygen to Brain but normal Oxygen Levels?

Part of the model that I work off is hypercoagulation. This slows down blood flow so less blood gets pushed to the tissue per minute. If you take a sample of your blood — oxygen levels will appear normal.  This chart from a 2004 study shows that CFS patient has a lower rate of blood flow. The top chart shows up to 20% decreased speed for CFS patients (potentially 20% oxygen presented to tissue).

Blood flow Speed is less with CFS

Hypothesis of Cause

I believe that hyper-coagulation (“thick blood”) may account for the above. Soluble Fibrin Monomers can be viewed as a thickening agent to the blood. While the total volume stays the same, the volume of red blood cell is decreased. The fibrin fragments also act as mesh resulting in smaller cells (from them being forced thru it) as well as deforming them. Simpson reports that Ginko, Evening Primrose Oil and B12 improved the shape[source]; two of these are known anti-coagulants.

Can be microbiome be involved?

  • Some bacteroides  break down coagulation [1986], low bacteriodes may increase coagulation could be suspected.
  • Enterocolitis generates platelet-activating factor, and induces a coagulopathy. [2013] [1991]

Microbiome: #4 Gut Bacteria Testing – Antibiotic shifts

A recent study on Microbiome and Crohn’s Disease included some interesting graphics.

Antibiotics impact on CD Microbiome

” we observed a strong effect on the microbial composition, and exposure to antibiotics generally amplified the dysbiosis.”

There was also a nice presentation of the shifts (NOTE: CD had excessive E.Coli, CFS has decreased E.Coli)

Screen Shot 2014-03-17 at 8.30.07 AM

Bottom Line

The above does not directly apply to CFS, but it is an excellent model of how studies on CFS dysfunctional microbiome should be studied.  For shifts in bacteria due to antibiotics, it should be done on a family by family basis.

Gut Bacteria Testings – Part 3: Available probiotics to address test results

After getting the results aggregated I reviewed the probiotics that I have suggested being beneficial, especially Prescript Assist (which I had recommended solely on the basis that it was effective for IBS).

I will call out the real interesting matches:

Bacteria Grouping Name Prescript Assist uBioma Ref Ubiome1 UBiome2 RedLab Ref RedLab1
Streptococcus Streptococcaceae Yes 0.75 -8.22 <1 Low
Corynebacteriaceae Yes (Kurha) 0.14 -24.00 -28.77
Streptococcaceae Yes (Streptomyces) 0.76 -8.23 3.51
Clostridiales Family XI Incertae Sedis Yes (Myrothecium) 2.19 -45.24 -26.99
Pseudomonadales Yes (Acinetobacter, Arthrobacter) 0.01 -7.00
Rhodospirillales Yes(Azospirillum) 0.79 -311.00 -320.00
Propionibacterium In Securil Probiotics 0.02 -16.00

This is awesome (and may explain why it works for IBS also).

Other Probiotics for low levels are:

  • Mutaflor (E.Coli Nissle 1917) – only source available
  • Securil Propio-Fidus Probiotics (for Propionibacterium, only source available
  • Align or any other ONLY bifidobacterium probiotics, for example
    • 4XProBiotic Caplets on Amazon (84 capsule for $35) – Bifidobacterium infantis, Bifidobacterium lactis, Bifidobacterium longum, Bifidobacterium bifidum. Note: Bifidobacterium infantis is the same species as Align, but not the same strain — it may be effective for IBS (no studies on pubmed)
  • Some Oral Probiotics, for example
    • Now Foods OralBiotic on Amazon (60 capsule for $14) – Streptococcus salivarius BLIS K12
    • Oragenics Evora Plus Probiotic on Amazon (30 mints for $16) – Streptococcus oralis, Streptococcus uberis, and Streptococcus rattus

You may also wish to review my earlier list of non-lactobacillus probiotics.

Time to flip the question?

Traditionally we view illness from bacteria as being caused by too much of some bacteria. After looking at these results, I am tempted to flip the question and ask “Is the illness due to too little of certain essential bacteria?”  Think of a city – garbage collectors and cops are essential but only a small percentage of the population. If they are eliminated or no one willing to do that job, the city becomes a very unhealthy place. The same analogy may apply to these bacteria that have had a major reduction in population.

Gut Bacteria Testing: Part 2 – what CFSer have gotten back from the labs

This page is an attempt to merge citizen science with professional science to paint a better perspective on how the gut bacteria is altered in CFS. This is a technical page which may cause information overload (even without CFS!)

My model is that 70-90% of the CFS symptoms are directly related to the dysfunction bacteria in the gut. Different symptoms, different bacteria. Same symptoms, likely similar bacteria. Since CFSer have different symptoms, I expect some common dysfunction and some dysfunction which will only occur for some people.

I attach my detail tables as here. Below are what I have identified as common across the data. As data grows, more patterns may appear. There are likely data errors in my transcriptions which I will correct over time.

I would suggest opening http://en.wikipedia.org/wiki/List_of_Bacteria_genera to help understand where each item belongs. If you look up a specific item in Wikipedia, the hierarchy is usually shown on the right side, as shown below:

Akker

I will not attempt to interpret the meaning of the dysfunction in this post — strictly present the raw data!

Common Results from Ubiome

Although there are only two results share at the moment (and a few folks are waiting to receive their), there appear to be some commons shifts.

The following are limited to where BOTH results have a factor of 10x shift in the same direction from normal readings. All of the shifts were negative (i.e. much much less of these bacteria)

Red Labs

Above we see a recurring pattern of major decrease of families and genus of bacteria. Going over to the single report from Red Labs, I see almost all of the references is almost a steady stream of “<  N”, in other words  it is focused on detecting OVERGROWTH and not undergrowth (with just 4 with > N ),.   In my analysis of the results (in the spread sheet attached), I assumed that a report of “0” in this scernario indicated undergrowth (Low). I am not completely happy with having to make that assumption and would prefer to see Red Labs amend their labs with ranges.

Of the four testing explicitly for undergrowth ( > N), we had three positives:

  • Bifidobacterium (Bifidobacteriaceae) – seen in all Ubiome results that I had for this (1), Reported in 1998 Study
  • Asaccharobacter (Coriobacterineae) – one slight up, one slight down with Ubiome
  • Ruminococcus (Ruminacoccaceae) – seen in 1 /2 of Ubiome results

BioScreen

Just one sample reports from one person.

  • Coliforms (E.Coli) Low
  • Aerobe High
  • Streptococcus High
  • Clostridium High

Genova

  • Both sample reports reported low Beneficial E.Coli
  • Other results in disagreement between reports

Older Studies [1998]

These personal results appear to be in agreement.

  • Enterococcus reported low for CFS (Enterococcus/Enterococcaceae/Lactobacillales) – Only Ubiome report on this  had -67 x decrease. Red Labs had Zero reported
  • Lactobacillus reported low for CFS – One Ubiome reported -26 x Decrease, and Red Lab reported Zero
  • E.Coli reported low for CFS – Red Labs reported Escherochia only and found Zero. Genova low (or none). BioScreen low.

Bottom Line

With our very small sample, we have replicated the 1998 results as well as identify other families of bacteria that also show the very low characteristics.

We need more reports – with uBiome being the clear winner for usefulness. If you have not order uBiome or AmericanGut kits, and wish to contribute $100 to CFS research — seriously consider doing so and forwarding your results to me. I am hoping that both uBiome and AmericanGut will enable a complete download of the data so that sharing and analysis will become much easier with less chance of typographical mistakes.

Gut Bacteria Testing: Part 1 – what you get back from the labs

This is the first of a few posts looking at Gut Bacteria testings. There are many labs offering such with a wide variation of information on the information and what is tested.

The Ideal Report

Before looking at individual results, I would live to describe what I would love to see:

  • Measurements for each of the following containing:
    • Your reading,
    • Average reading of a healthy population
    • Standard deviation of a healthy population
    • Reading of the lowest 5% of a healthy population (why? I expect distributions to not be a normal bell curve)
    • Reading of the highest 5% of a healthy population (why? I expect distributions to not be a normal bell curve)
  • Measurement by the Gram-Positive species, Gram-Negative species
    • Measurement by Phylum
      • Measurement by Class
        • Measurement by Order
          • Measurement by Family
            • Measurement by Genus
              • Measurement by Species
                •  Measurement by Strain

Nothing commercially available provides the above, but some are close. The diagram below is from Wikipedia commons and may help visual all of these terms.
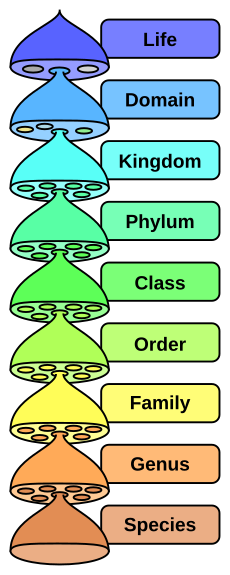
Hierarchy

Sample Reports

My readers have been kind to send sample of their reports. All of these are for CFS patients. In my next post, I will try to create a unified view of all of the data in these samples (and any more that I get emailed to me at Ken@Lassesen.com ), combined with results from the literature. Added to this in my next post, I will also include probiotics that I am aware of that may help correct deficiencies.  

The bottom line is that it appears that the most detailed information is provided by American Gut and uBiome. No MD order is required and the cost is $100 or less. It will not be covered by medical insurance. Most MDs and NDs will likely not known what to do with the report and some may attack the significant of the report because of lacking knowledge.

Ubiome.com

At the highest level, you get a summary by phylum. They provide 18+ phylum levels. At each level they provide the average and how far from the average your are. Without any information on the range of the values seen in healthy individuals, it is hard to establish that a value is actually significant unless it is 10x or more off.

2013-11-09 uBiome - Phylum

  • At the Class level,  16+ items
  • At the Order level,  24+ items
  • At the Family level, 34+ items
  • At the Genus level, 34+ items

Total readings: 285 readings

The information is available in the JSON format and provide significant detail, one example is shown below:

{“taxon”:”186824″,”parent”:”1385″,”count”:”1″,”count_norm”:”5″,”avg”:”1.000000000000000″,”tax_name”:”Thermoactinomycetaceae”,”tax_rank”:”family”}

This allows information from different patients to be easily combined for group analysis.

Genova Diagnostics

This firm has been offering tests for many years, and appear to have kept to old technology which has limited information. Their typical report is only 8 items as shown below

Geneva Results

When known as Great Smokies (2000)
Great Smokies Report (2000)

IMHO, their measurements is very weak, they use a private rating system that appear to have tunnel vision.

AmericanGut

No sample report yet (I have ordered kits)

Red Laboratories

A sample report is below. It is much superior to Genova:

  • Far more species
  • Weakness is that the measures are “one sided” and do not provide the expected normal range.
    • Example: MD’s only give significance to High Temperatures, CFS having below (down to 96F -3F) temperature is often ignored as insignificance, while + +3F temperature is significant. 0 This one-sided perspective is seen in other tests (like SED).  When the expected value is < 25 and the patient has zero (0) – it suggests that something significant may be occurring.

Red

Bioscreen

Bio1bio2