I have been contacted over the years of parents of children of various ages – one of the questions is how do their microbiome compare to adult ones. Can you detect abnormalities with them. This reviews the literature that I have been able to locate. I excluded studies for under 1 year.
- SHAPING THE GUT MICROBIOME DURING INFANCY, 2018 give a simple visual introduction from a conference presentation. Some material from
- Age-related changes in gut microbiota composition from newborn to centenarian: a cross-sectional study [2016]
- Age- and Sex-Dependent Patterns of Gut Microbial Diversity in Human Adults [2019] deals with 20 y.o. and up only
- Comparison of the development of the fecal microbiota of Indonesian and New Zealand children during the first year of life reveals differences in bifidobacterial taxa and microbiota complexity at 12 months.[2019]
- “B. longum subsp. infantis dominated the microbiota of Indonesian children whereas subsp. longum was dominant in NZ children. “
- Development of the Gut Microbiome in Children, and Lifetime Implications for Obesity and Cardiometabolic Disease [2018]
- In a small study of urban visitors to a traditional rainforest village, the microbiome of children was found to be more prone to change compared with a relatively stable microbiome in adults, highlighting the higher plasticity of the microbiome in children [74].
- Association of the Infant Gut Microbiome With Early Childhood Neurodevelopmental Outcomes An Ancillary Study to the VDAART Randomized Clinical Trial [2019]
- Characterizing Diversity of Lactobacilli Associated with Severe Early Childhood Caries: A Study Protocol [2015]
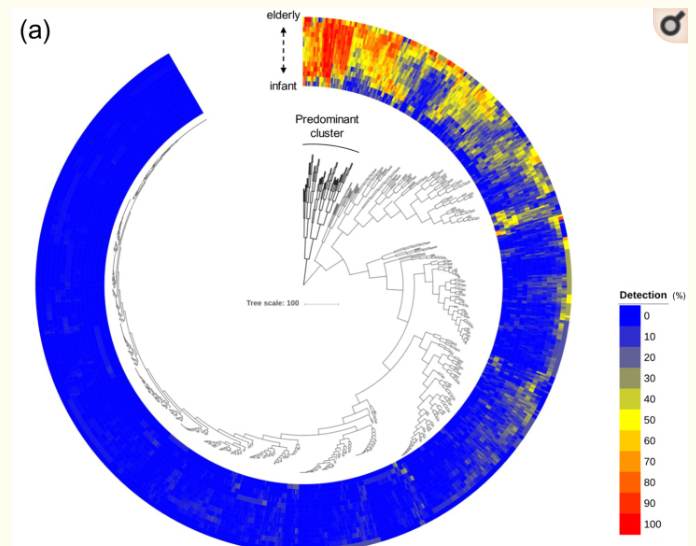
- Age-Related Changes in the Composition of Gut Bifidobacterium Species [2017]
- Long-term colonization exceeding six years from early infancy of Bifidobacterium longum subsp. longum in human gut [2018]
- Genomic diversity and distribution of Bifidobacterium longum subsp. longum across the human lifespan [2018]
- Gut Bifidobacteria Populations in Human Health and Aging [2016] – Warning: study charts are base on hypothesis and not actual measurements.
In a comparison of 20 children and adolescents with ASD and 20 neurotypical control individuals between the ages of 3 and 16 years, those with ASD had lower abundances of the gut microbiota Coprococcus, Prevotella, and unclassified Veillonellaceae.9 A more recent study also found differences in gut microbial composition among children between the ages of 3 and 12 years with ASD and gastrointestinal symptoms compared with 41 typically developing controls also with gastrointestinal symptoms.10 However, in cross-sectional analyses, it is difficult to know the directionality of observed associations. … The postnatal gut microbiome is remarkably dynamic up to 3 years of age, which is also a critical period for brain development.22
Association of the Infant Gut Microbiome With Early Childhood Neurodevelopmental Outcomes An Ancillary Study to the VDAART Randomized Clinical Trial [2019]
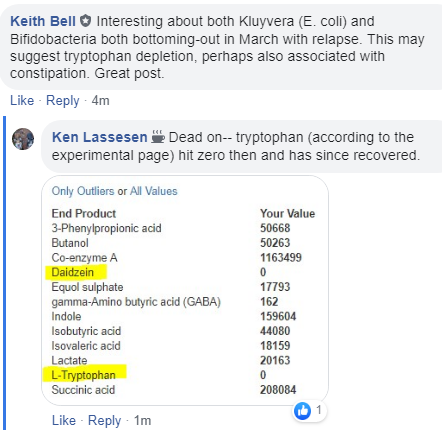
Bottom Line
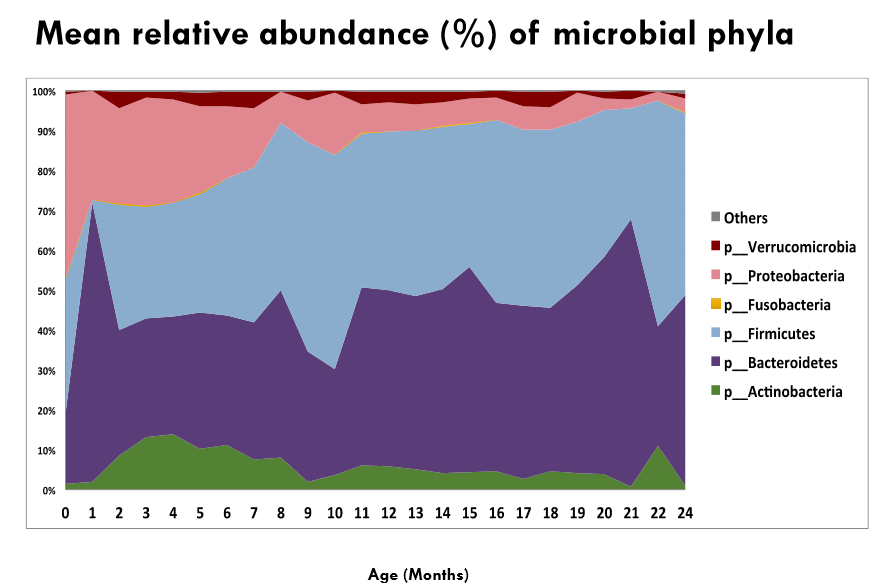
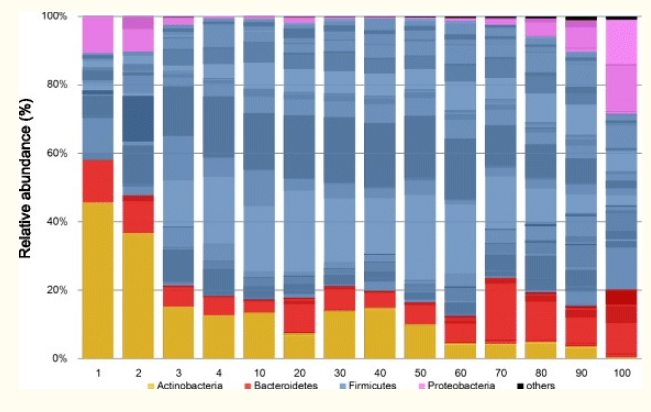
It is very difficult to come to any conclusions about whether a microbiome is dysfunctional or now before the age of three unless there are extreme shifts. From the age of three onwards, there is relative stability that changes around 60 as shown below. As a result, I am adding age to the symptoms entry.
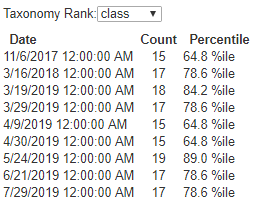
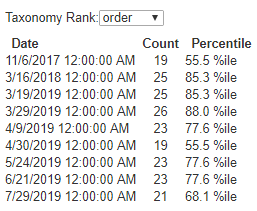
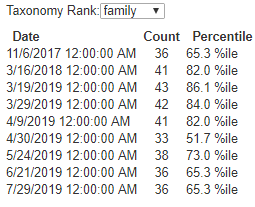
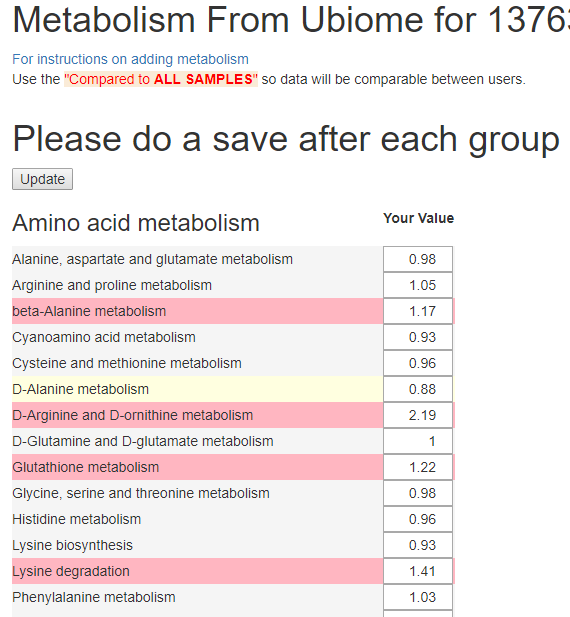
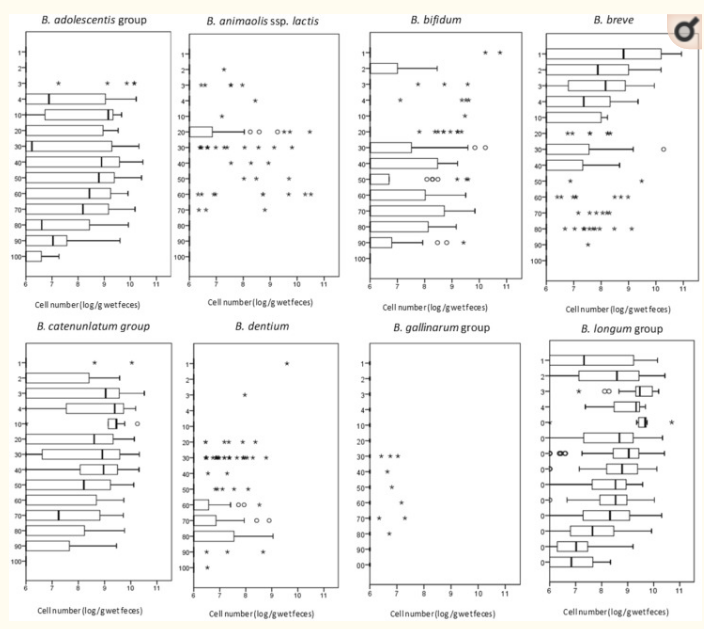
At finer level, we see the wide variety of measures (Note: these are showing boxplot lines – the range of normal is age dependent!!). Once I get enough samples with ages added, I will update the boxplot numbers to match age also – the study only had 371 samples. These plots also illustrate why averages can rarely (if ever!) be used to reliably determine it there is a problem!
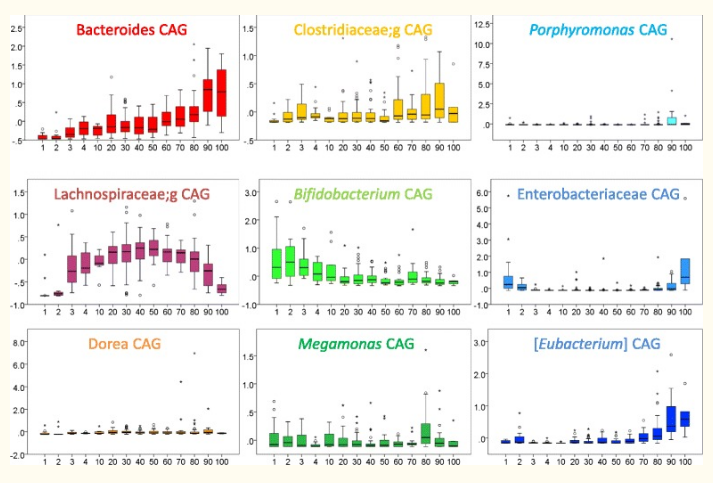
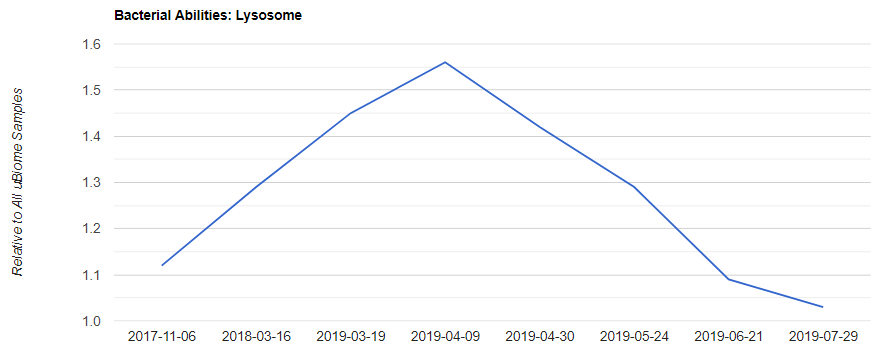
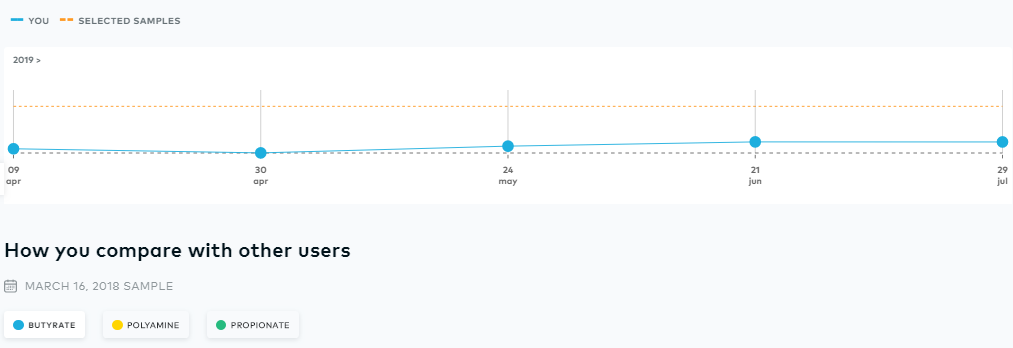
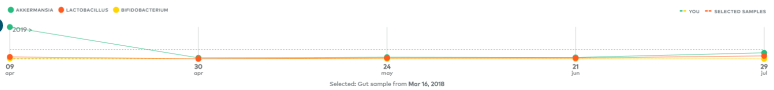
The next chart takes a few brain cells to understand, but it is informative once the presentation kicks in
Bottom Line
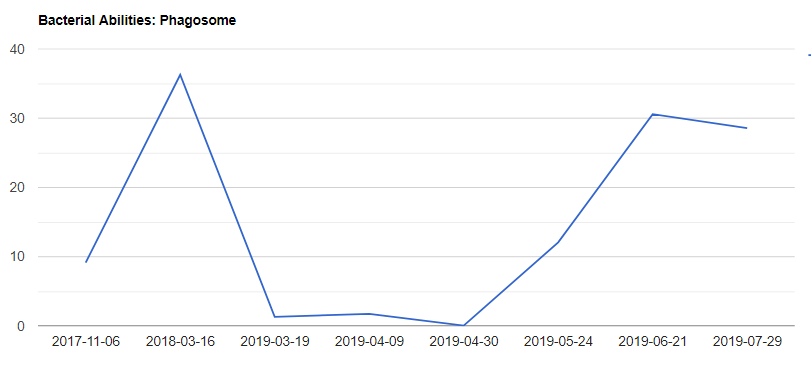
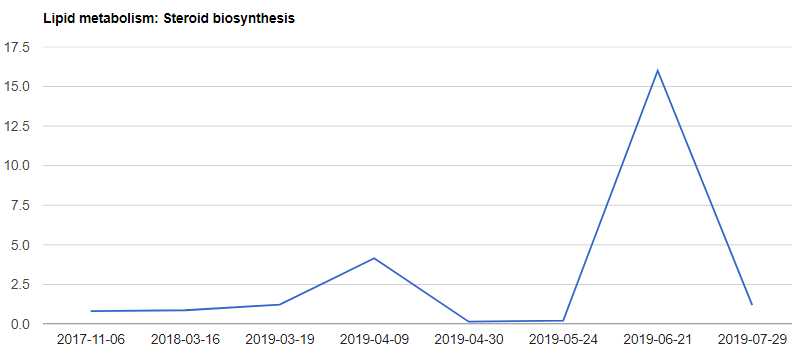
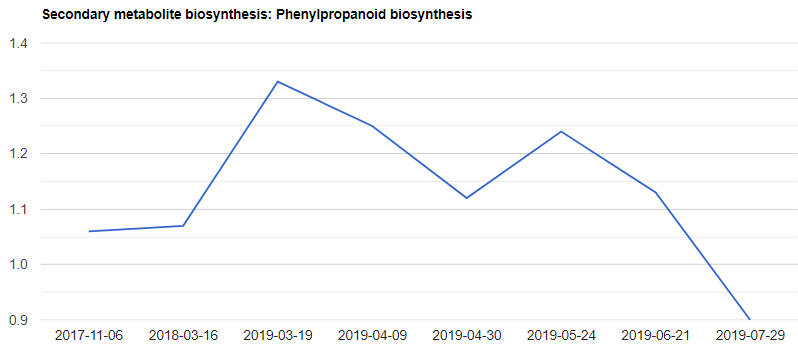
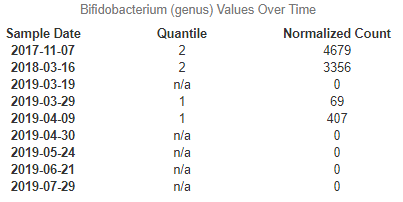
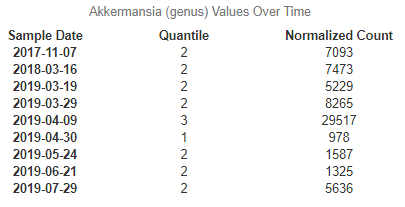
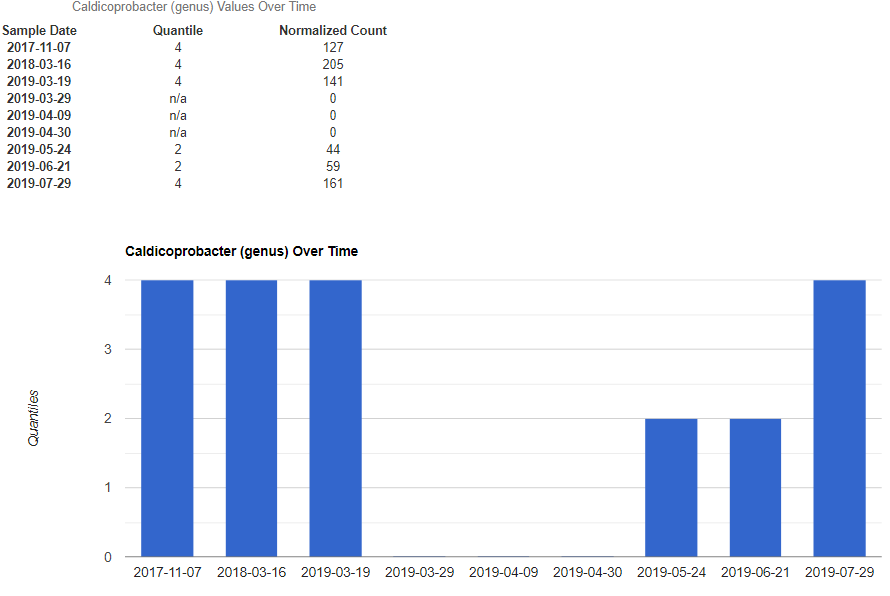
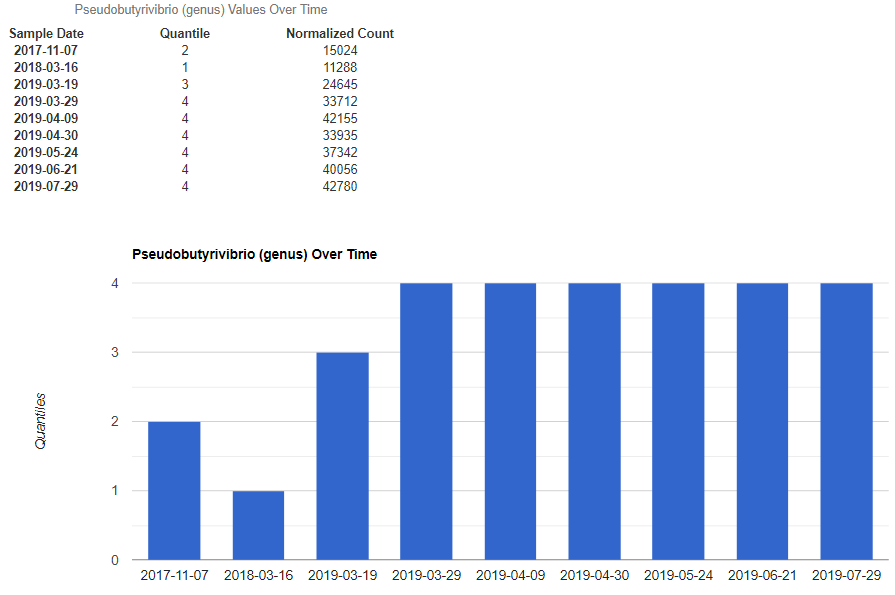
For a child under 10, sudden great changes of a bacteria is a indicator of dysfunction — but this implies ongoing measurements. All of the sample sizes in studies that I found are too small to have great confidence in evaluating a sample. Having reference data is essential for the microbiome (with my relapse and recovery, having two ubiome results from before the relapse gave me a basis to work from).
If you (or your child) is in poor health and a sibling is in good health, because of the amount of inheritability of the microbiome, their microbiome to use as a reference is better than nothing. Healthy parents are the next step for getting a reference (much weaker).