ubiome followup

This ubiome sample was done a week after my last posting. Some interesting things happened during the week:

Changes

  • I stopped taking 100-150 BCFU per day (because Lactobacillus et al ) were not at the top of suggestions
  • Changed probiotics to Bacillus Coagulans (Digestive Advantages) instead of Bacillus Clausii (Enterogermina)
  • Stopped supplementing with Potassium Citrate, Folate and Berbine

Consequences

  • Found myself becoming quickly fatigue physically
  • Fatigue accompanied with overheating feeling.
  • Stools became very burning with frequency increasing every day
  • Tested a vial of Bacillus Clausii and could literally feel things becoming better
  • Leg cramps, sore muscles across the body

Response

After getting the sample for ubiome, returned to 100+ BCFU of lactobacillus et al probiotics taken with organic yogurt. Stool burning and frequency declined within 12 hours.

When I re-introduced Potassium Citrate, the leg cramps and sore muscles disappeared. I seem to be resetting to where I was 10 days ago.

I wanted to get the sample to get some insight on what went wrong.

Changes

Loss of the little progress that was made was lost.
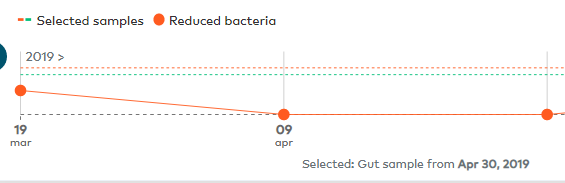
High bacteria decreased more, but low bacteria increased
Biogenic Amine.

Drill down into specifics

Looking at the raw data for this sample

  • Lactobacillus paracasei is at 29/ /1000000
  • Lactobacillus casei is at 29/1000000

For prior sample:

  • Bifidobacterium animalis 33/1000000
  • Bifidobacterium longum 373/1000000
  • Lactobacillus curvatus 113/1000000
  • Lactobacillus casei 33/1000000

First sample after flare:

  • Lactobacillus: 162/1000000 with no species identified
  • No Bifidobacterium

Prior to flare

  • Lactobacillus: none
  • Bifidobacterium 3356/1000000
    • Bifidobacterium bifidum 36/1000000
    • Bifidobacterium animalis 434/1000000
    • Bifidobacterium longum 2885/1000000

It looks like the B.longum and B.animalis were making a comeback after the flare eliminated them with approximately the same ratio. It does hint that
Bifidobacterium animalis and Bifidobacterium longum probiotics are desired to assist.

Unchanged

Change of Suggestions

The new Advance Suggestions makes it easy to compare suggestion between samples. For you current sample, tune the suggestions appropriately. Then just select another sample and see the results. Comparing this (downhill) with the prior sample (uphill), I saw some interesting flips:

  • Folate (B9) flipped from avoid to take
  • Berbine flipped from avoid to take
  • Resveratol (grape seed extract) flipped from avoid to take

This causes me to be careful when something flips from take to avoid when things are improving. The suggestions are just that suggestions (based on a healthy microbiome data). It also indicates that some microbiome populations had significantly altered.

Bottom Line

By symptoms, I knew that I had lost ground with the modifications that I made; this appears to be confirmed by the results. I am restoring the above three to my supplements and then waiting a week before doing the next uBiome sample. I have been doing seed probiotics for a week now, and I am curious if this human source probiotics has any persistence.

A new rule is suggested

If things are improving and a new test’s suggestion says stop on what the last test suggestion says take. — Ignore it.

Seeing the species that may need correction

Some readers have requested that I show the list of bacteria that were selected to make suggestions from. I have done some refactoring and they are now available from three different ways of selecting bacteria that are available on the site now. Reports go down to the strain in some cases.

Choices for Determining What you wish to change

Once you have logged on, if you select Advanced Suggestions


http://microbiomeprescription.com/email/samples

You will go to the custom suggestions page. On this page, you will see your samples and links for Bacteria Selection choices.


http://microbiomeprescription.com/data/CustomSuggestions?sampleid=….

There are multiple paths available for determining what could be wrong, and thus what you may wish to modify. Click on the above high lighted link will show you the actual bacteria picked from each of these methods. A short summary of each is below:

  • Bacteria that has an association with symptoms that you have and you are an exact match. This will be the smallest list — but it is the most certain of being right
  • Bacteria whose population are outliers (that is far away from the expected patterns). This is the medium size list — it is uncertain if they are significant
  • Bacteria above or below normal ranges. This is the simplest to understand and may be most leading. The typical 16S report has 500 to 1500 bacteria listed. Assuming the normal range is the middle 90% (5% high and 5% low), we would get 50 to 150 bacteria listed here by random chance.
The Parents and Grandparents are included because most people do not know which family some genus or species is in.

I did some counts on different samples, which confirms the counts from each method.

Note: The symptom and outlier filter is dynamic. As more data is added, their ability to detect improves. For symptoms, there must be 16 people people reporting the same symptom before we will do detection of association.

In Summary

You can try all three methods, and experiment. You really want to get the smallest list of bacteria (because in figuring out suggestions, the more bacteria you include, the more complex it gets!).

For myself, I did suggestions from each and found a few items appeared in common with all of them. Those items are definitely on my list (“Almonds in the morning, Almonds in the Evening, Almonds at supper time”) sung to the tune below..

https://www.youtube.com/watch?v=bRvEHn6fKWE

Bacteria+Symptoms=>Critical bacteria

This is taking the associations of bacteria to symptoms found for the entire population and applying it to the symptoms you have recorded and your uploaded microbiome.

If you have not recorded your symptoms, nothing will appear.

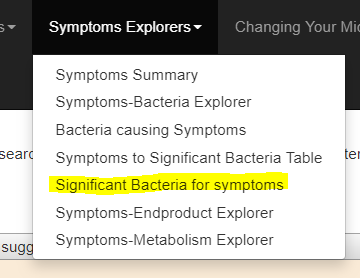
After you have logged on, a new menu item will appear:

When you select this, you will be taken to the new page.

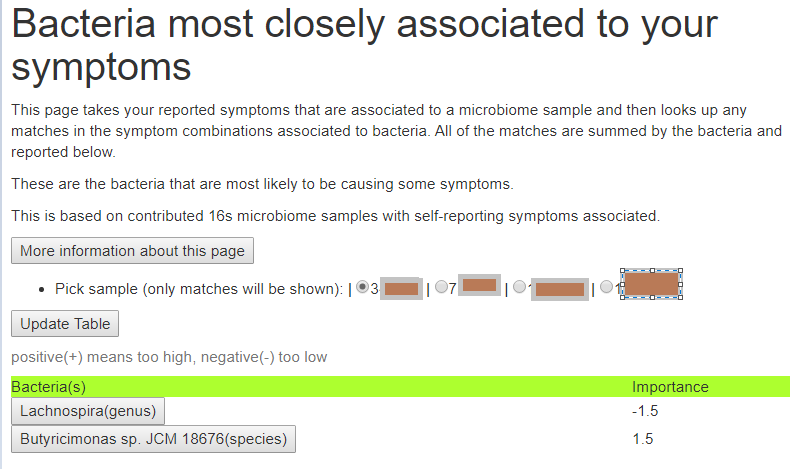
Mine when relatively symptomless

The number can vary greatly — only precise matches are shown. In some cases species will be shown.

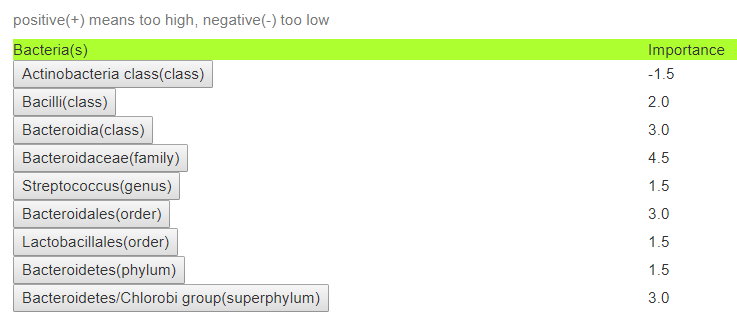
This is mine during a myalgic encephalomyelitis flare.

Above, Streptococcus(genus) parents are Lactobacillales(order) and Bacilli (class).

A reader’s example is below

atypical crohn’s disease

Symptoms to Bacteria Table

This new page, shows the pattern for Symptoms found with statistically significant correlation to some bacteria.

Reminder

We do this by looking at all of the samples, sorting the values in order, then divide into 4 equal parts. From the equal parts we get boundaries. To check a condition, we take these boundaries and see how many fall into each. If there is no relationship, then the numbers in each of these 4 parts should be equal. If they are not, and are very different, we can compute the odds of this happening by random chance. If the computed odds is too low, we say that there is likely a real relationship involved. The Expected column is what we would expect to see in each of the 4 parts, it will help you see what is abnormally high or low (or both).

  • Looking at the first row, we see that no Health Issues is associated with most of these people having very low numbers of a specific Anaerotruncus species.
  • Further down, we see that a Dora Species tend to be clustered below average for Females. For Butyricimonas, there may be two pattern – one very low (31) and the other in the median high (22). Why is a matter of speculation.

You have the ability to look at different ranks of bacteria taxonomy, as well as the number of symptom combinations.


How does my Microbiome compare?

If you have uploaded your microbiome and are logged on, you will see your various samples listed. Picking one of them will show where you have a match.

The matches are to the highest frequency in the pattern. Your value is show in pink.

Remember – this is not PREDICTIVE. just showing associations.

Look at the matches and compare to your symptoms. If you have those symptoms THEN the bacteria is likely a significant player. You want to move your values towards the middle (increase or decrease).

The Rosetta Stone for Microbiome Correction

This week I applied an old technique to microbiome analysis which I remember using to solve some messy problems that I was dealing with professionally back in 1982. The solution was to return to the question or assumption without going down the path mostly travelled.

Almost all of the microbiome analysis studies that I have read contains wording such as shown below. The study focused on ratios of bacteria and not relative distribution patterns of bacteria.

demonstrated that the dysbiosis could be characterized as directed alteration of the microbiome composition leading to greater disparity between relative abundance of two phyla, Bacteroidetes (Z = 4.77, q = 1.59 × 10) and Firmicutes (Z = -3.87, q = 5.83 × 10). 

Characteristic dysbiosis of gut microbiota of Chinese patients with diarrhea-predominant irritable bowel syndrome by an insight into the pan-microbiome. [2019]

I will jump into the real world to explain a bit how we do this.

In the non-microbiome world

Suppose the question is whether there is wage disparity between Canadians and Australians working in Silicon Valley. The classic test is to find the average wage of each and see if there are significantly different. This is the approach done in microbiome studies.

Instead, a clever data scientist decides to get the actual wage from everyone and then divide the wages into the lowest quarter (25%), low quarter (25%), high quarter(25%) and top quarter (25 %). You would expect the number of Canadians and Australians to be roughly equal in each — but it is possible (with the same average) for them to be very different, for example:

  • 0-25%: Australian 40, Canadians 60
  • 25-50%: Australian 90, Canadians 10
  • 50-75%: Australians 30, Canadians 70
  • 75% up: Australian 40, Canadians 60

Clearly, Australians tend to end up in 25-50% – 45% of them, and only 5% of Canadians. Some of the top pay went to Australians — resulting in the same average. Looking at it this way, we see a salary dysfunction. Not only do we see it, but we can actually determine the odds of this happening at random by doing a chi-2 test, and find that the odd > 1/10,000,000. There is a statistical significant bias in salaries.

The ability for the common person to see the issue

Below is an example for a mixture of conditions.

Bacteria Distribution Example

We see shifts towards higher values, but not the highest range. The expected amount in each quantile is between 4 and 5 (add the numbers and divide by 4). We see the highest values are often close to expected values, the dysfunction is an upward shift, but not a clear overgrowth. Looking only for overgrowths or undergrowths is why the patterns were not seen by researchers.

When I applied it to this problem, I was literally blown away with the massive number of associations exposed.

See this page for more information on doing this.

A Massive list of relationships

If you go to the full listing of relationships – relationships discovered when you combine multiple symptoms, you will find some 15000 items have been discovered. Fortunately, I have ordered the list in alphabetical sequence to make it easier to view. Click here to go to this page.

All of the above are sleep related, but sleep is not connected to a single bacteria. Sleep issues are likely a side-effect of the other symptoms.

The thing that I really like is the ability to click on any symptom combination and see the actual numbers.

Correcting the Microbiome

This actually gives us, in theory, a much more targeted approach. Using the microbiome and the symptoms, we can infer which bacteria are needing to be increase or decrease. We are no longer talking about high values and low values, but correcting minor shifts.

If you have the symptoms for ‘Bacteria Distribution Example’ above, and we have your microbiome, we can ask the question: Are you in Quantile3 for Flavonifractor? If so, we want to change it. We can go up or down, well, downwards has a greater difference from the expected — so we should go in that direction. KEY CONCEPT: You may not be actually in the high group for
Flavonifractor, your values indicate that this was more likely an upward shift.

This becomes a very nuisance adjustment of the microbiome.

New Suggestion Page in the works

This may take me a few days to code uo and test. To use it, you will need to upload your microbiome AND also enter your symptoms/characteristics when the microbiome was taken. Both are essential for the new suggestions page in the works.

I have revised the site finding where to enter symptoms is clearer.

and made the symptom page easier to use.