Cardiac Disease and the Microbiome

A reader who has several family members with conditions that have microbiome shifts associated asked about cardiac disease, which is frequent in one side of the family.

Below is what I could find. This is a new area of research that I expect to explode in the next few years.

” Dysbiosis of the intestinal flora has been associated with insulin resistance, diabetes mellitus and cardiovascular diseases, such as atherosclerosis and heart failure. ” [2019]

” In the recent years, both human and animal experiments have revealed that alterations in the composition and function of intestinal flora, recognized as gut microflora dysbiosis, can accelerate the progression of cardiovascular diseases. “[2019]

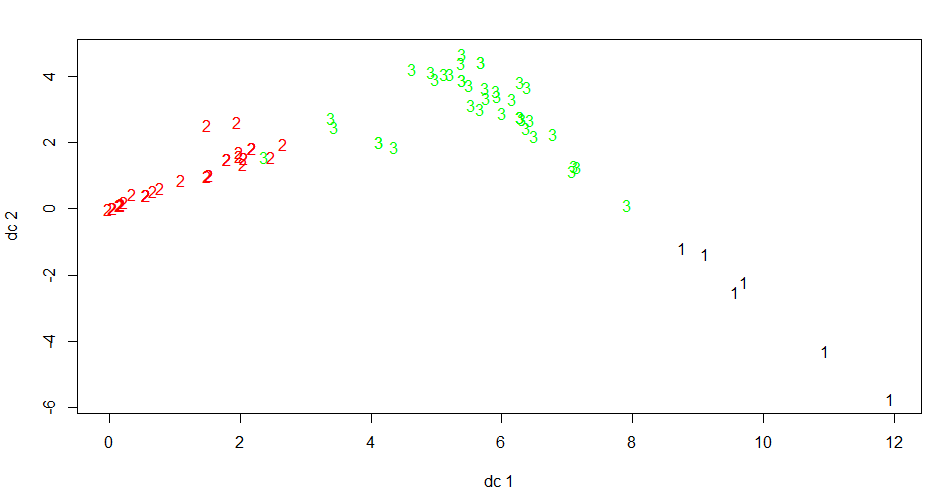
The gut microbiomes of VC and CAD patients were significantly different in terms of beta-diversity. Bacteria from Veillonella dispar, Bacteroides plebeius and Fusobacterium were enriched in the VC group, while members of Collinsella aerofaciens, Megamonas, Enterococcus, Megasphaera, Dorea and Blautia were decreased. According to the association with dyslipidemia, seven operational taxonomic units (OTUs), including Parabacteroides distasonis, Megamonas, Fusobacterium, Bacteroides sp., Bacteroides plebeius, Lactobacillus and Prevotella copri, were regarded as potential pathogens for CVDs. Additionally, Prevotella copri might be a keystone of CVDs, especially in VC patients, while Collinsella aerofaciens is a possible keystone of CAD, based on the multi-correlations of these bacteria with other OTUs in microbial communities.

The intestinal microbiota associated with cardiac valve calcification differs from that of coronary artery disease[2018].

Bottom Line

You will note that almost all of the studies cited above were done this year and last year. This is an area that is actively being researched because the evidence indicate strongly that there is a relationship.

Endocrine organs of cardiovascular diseases: Gut microbiota [2019]

Because cardiac disease has many divisions and the amount published on each is sparse, I will not include this on my analysis site yet.

Transparency of new Algorithm Suggestions

Some early feedback has resulted in my adding a new page. This is providing more detail on this earlier post. On the Analysis page (where you are sent once a sample is selected), you will see a new link, shown below:

Clicking on this will take you to a page showing the 10 most atypical bacteria (all levels), as shown below. Three examples — all for the same person over 3 years. With the new algorithm, too low is rarely seen.

Clicking on the name will take you to the reference library so you can see the known information about each. This allows you to custom build your suggestions (instead of automatic suggestions).

New Suggestion Algorithm

Determining what is or is not a significant shift in the microbiome is challenging. My original algorithm on
http://microbiomeprescription.com/ was based on reverse engineering the normative values that uBiome appear to be working from. This was a quick and dirty solution — what was possible a year ago. Doing some R analysis of the contributed microbiomes and rethinking the issue of determining what is atypical, I borrow some algorithms/observations from a work project whose goal was to detect abnormal behavior of computer systems.

Both microbiomes and complex computer system tend to share similar challenges: they are not normal distributions and often long tailed (skewed) which means that averages and standard deviation often produce poor results for detecting abnormal values.

We will Box Up the Issue!

A common process in filtering data for machine learning etc, is excluding outliers. We are actually interested in finding the outliers! This is often done by boxplots. An example of some of phylum level bacteria is shown below. (Note 1.0 = 100%)

outliers are the round circles

And we can do it to lower levels, for example, order

Down to Species

The solid black line is the median (almost an average). For B.Vulgatus we see that the range of values from 25%ile to median is almost the same as median to 75%ile. For B. uniformis, this is very different.

New Algorithm looks for these outliers and only deem these to be significant. For a post showing more details, click here.

What is the main difference?

I put several samples thru comparing the NUMBER of bacteria shifts deemed significant. The first number is with the old algorithm, the second number is with this new algorithm.

  • 181 -> 55
  • 193 -> 56
  • 160 -> 43
  • 133 -> 33
  • 133 -> 29

In theory this means that we are much more focus on the major shifts and not any shift. You can see the number of items identified on the suggestion page.

Where you will see it:
http://microbiomeprescription.com/email/analysis?….

Again — this is experimental (as the entire site is).

More R and Microbiome

Clustering

Clustering is bunching observations (people’s microbiome) into groups based on similarity. In english, we want to see if one people with shift in one type of bacteria also have a shift with a different type.

Phylum Level

I am starting by looking at a higher level, so there are less factors to consider. The data is easy to download. [phylum <-read_csv(“http://lassesen.com/ubiome/TaxonomyByphylum.csv&#8221;) ]

After this we scale the data and proceed to explore.

First a Box Plot

This shows the odds of outliers (data is scaled remember). We see Bacteroidetes are well behaved (normal distribution), but phylums like Actinobacteria, Verrucomicrobia, Proteobacteria, and Firmicutes have atypical behavior.

Bacteroidetes vs Firmicutes

These are the dominant two phylum. When we plot the data we see a clear ‘trade off’ pattern between them. We also see that there is a number where Bacteriodetes < 0.1 (scaled).

ggplot(phylum, aes(Bacteroidetes,Firmicutes)) + geom_point()

Filtering to these low ones (86), removing the sampleId column, and searching for number of clusters that would classify these many observations, we see that there an ‘elbow’ at 3

Applying a dendrogram, we see that these 86 people fall into some distinct groups.

Plotting the cluster illustrates that we have good separation.

Looking at the averages by phylum for each of the groups we see some clear patterns:

We originally filter to Bacteroidetes < 0.1, but we see that this group could be divided into very very low (Groups 1 +2) and low (3).

Returning to other Phylum

Three plots are shown below — Actinobacteria, Verrucomicrobia, Proteobacteria

Odd line is seen below — almost a straight inverse line for one set of data

Homework

My purpose is to get people exploring the data. If you look at Data Science: Tax Rank and Symptoms, you can find the sampleIds with symptoms (a subset of the data above). The assignment is simple — can you find any symptoms that appear to be associated with the clusters you may have found?

You may wish to pre-filter to only the phylum with symptoms… and then cluster.

Rituximab failed large CFS/ME Trial

The results were not surprising for me — because the focus was on a single drug.

Overall response rates were 35.1% in the placebo group and 26.0% in the rituximab group (difference, 9.2 percentage points [95% CI, -5.5 to 23.3 percentage points]; P = 0.22). The treatment groups did not differ in fatigue score over 24 months (difference in average score, 0.02 [CI, -0.27 to 0.31]; P = 0.80) or any of the secondary end points. Twenty patients (26.0%) in the rituximab group and 14 (18.9%) in the placebo group had serious adverse events.

B-Lymphocyte Depletion in Patients With Myalgic Encephalomyelitis/Chronic Fatigue Syndrome: A Randomized, Double-Blind, Placebo-Controlled Trial [April 2019]

Back Story

The Rituximab saga began in 2004 when two oncologists noticed that Rituximab – a B-cell depleting drug often used in cancer – not only cured one of their patient’s cancer but eliminated their chronic fatigue syndrome (ME/CFS) as well. After two more ME/CFS patients responded similarly, they began their work on ME/CFS in earnest.

Norwegian Rituximab Chronic Fatigue Syndrome (ME/CFS) Trial Fails [2017]

I have personally met two people with CFS that had cancer — and the CFS disappeared with the cancer treatment (usually included chemotherapy).

Cancer+CFS is not a CFS microbiome

A search on pub med for cancer and microbiome returns over 4400 studies. Cancer causes a change of the microbiome — yes, it may still be dysfunctional but it is dysfunctional in another way. The full cancer treatment protocol appears to reset the microbiome (likey by devastating it).

Chemotherapy and radiotherapy treatment regimens for gastrointestinal, peritoneal and pelvic tumours can disrupt the intestinal microbiomeand intestinal epithelia. Such disturbances can provoke symptoms such as diarrhoea, nausea and vomiting. Chemotherapy and radiotherapy induced gastrointestinal toxicity aggravating intestinal microbiome dysbiosis is postulated to adversely alter the intestinal microbiome, with a consequent induced pro-inflammatory effect that disrupts the intestinal microbiome-epithelia-mucosal immunity axis.

The role of adjuvant probiotics to attenuate intestinal inflammatory responses due to cancer treatments. [2018]