This is useful for those who multiple report and wish to see what is trending. On the [Compare Samples to Each Other] page
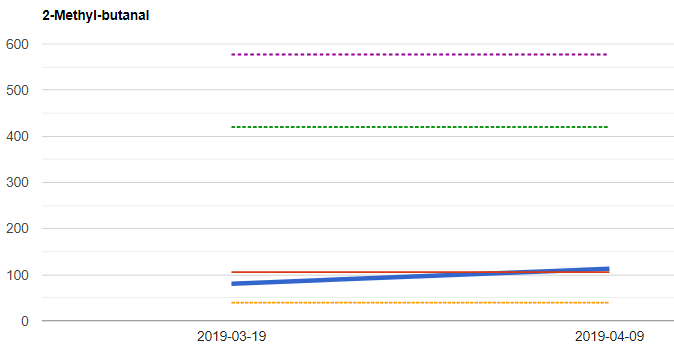
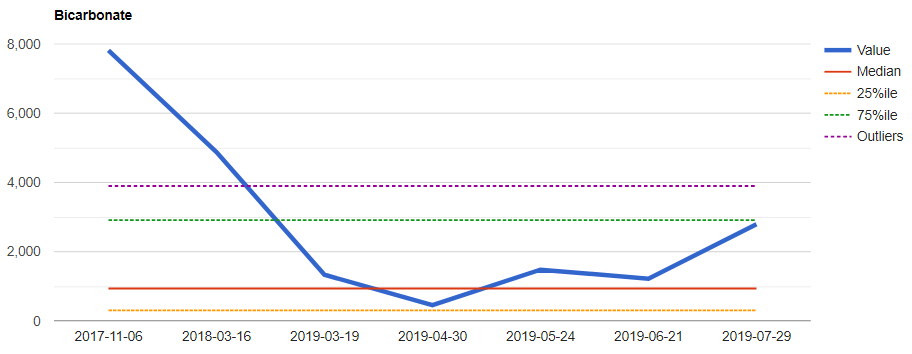
Below I have all of my samples being included and picked a few interesting charts for illustration. The Outlier line is from BoxPlot methodology and when crossed, suggests something may be interesting.
This showed up on set and then disappeared quicklyMy normal is a high amount of this End Product — it dropped and in recoveryRapidly increase at onset and subsequently reduced.Collapsed with onset and slowly recovering
I have been contacted over the years of parents of children of various ages – one of the questions is how do their microbiome compare to adult ones. Can you detect abnormalities with them. This reviews the literature that I have been able to locate. I excluded studies for under 1 year.
In a small study of urban visitors to a traditional rainforest village, the microbiome of children was found to be more prone to change compared with a relatively stable microbiome in adults, highlighting the higher plasticity of the microbiome in children [74].
In a comparison of 20 children and adolescents with ASD and 20 neurotypical control individuals between the ages of 3 and 16 years, those with ASD had lower abundances of the gut microbiota Coprococcus, Prevotella, and unclassified Veillonellaceae.9 A more recent study also found differences in gut microbial composition among children between the ages of 3 and 12 years with ASD and gastrointestinal symptoms compared with 41 typically developing controls also with gastrointestinal symptoms.10 However, in cross-sectional analyses, it is difficult to know the directionality of observed associations. … The postnatal gut microbiome is remarkably dynamic up to 3 years of age, which is also a critical period for brain development.22
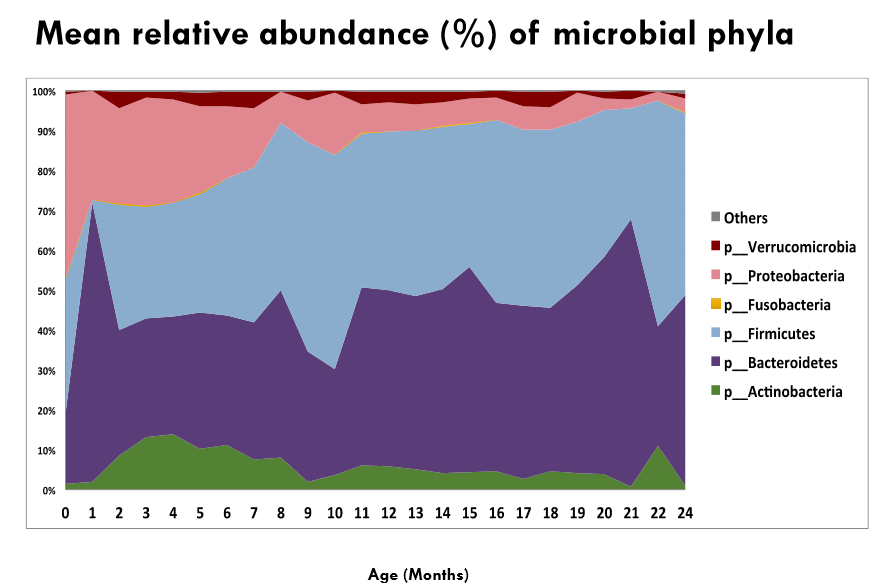
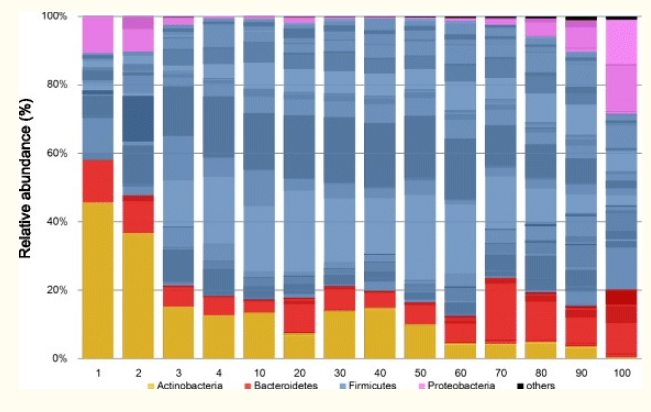
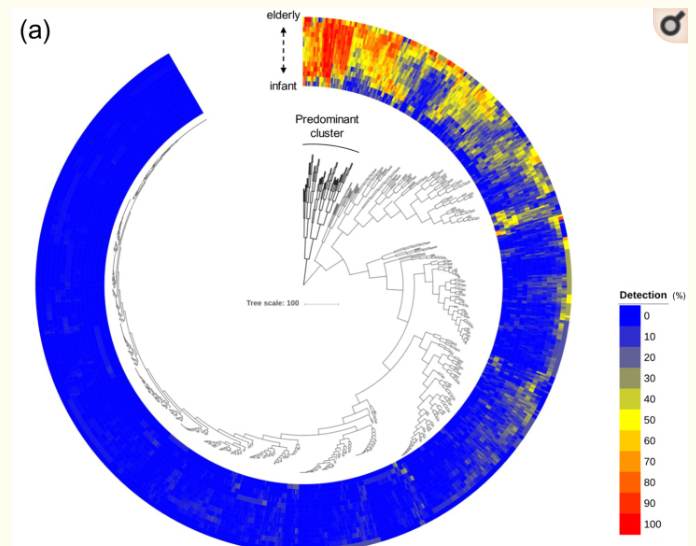
It is very difficult to come to any conclusions about whether a microbiome is dysfunctional or now before the age of three unless there are extreme shifts. From the age of three onwards, there is relative stability that changes around 60 as shown below. As a result, I am adding age to the symptoms entry.
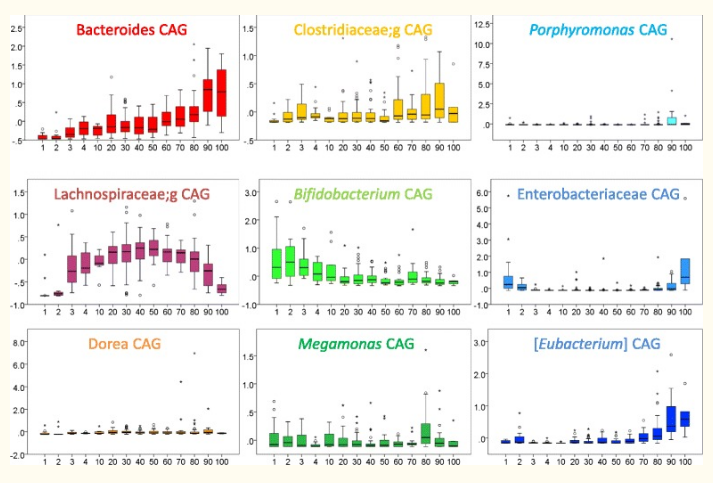
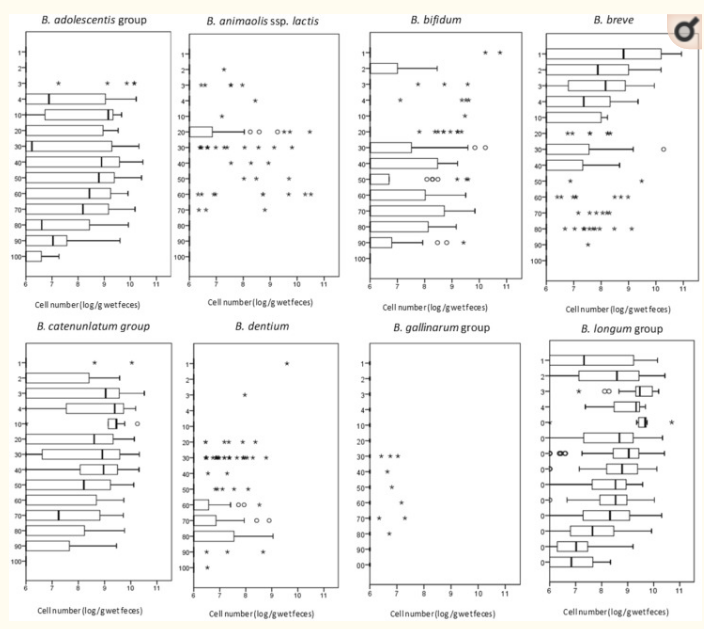
At finer level, we see the wide variety of measures (Note: these are showing boxplot lines – the range of normal is age dependent!!). Once I get enough samples with ages added, I will update the boxplot numbers to match age also – the study only had 371 samples. These plots also illustrate why averages can rarely (if ever!) be used to reliably determine it there is a problem!
The next chart takes a few brain cells to understand, but it is informative once the presentation kicks in
For a child under 10, sudden great changes of a bacteria is a indicator of dysfunction — but this implies ongoing measurements. All of the sample sizes in studies that I found are too small to have great confidence in evaluating a sample. Having reference data is essential for the microbiome (with my relapse and recovery, having two ubiome results from before the relapse gave me a basis to work from).
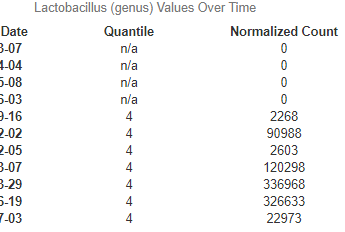
Lactobacillus became 33% of the microbiome from none.
If you (or your child) is in poor health and a sibling is in good health, because of the amount of inheritability of the microbiome, their microbiome to use as a reference is better than nothing. Healthy parents are the next step for getting a reference (much weaker).
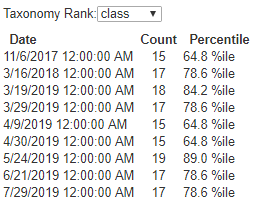
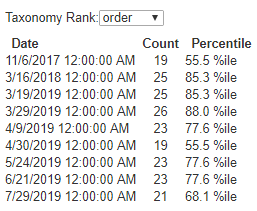
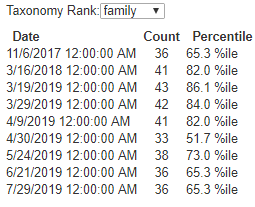
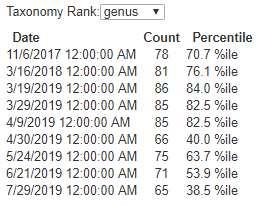
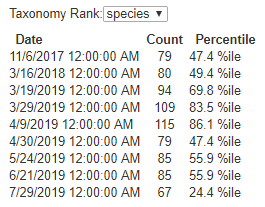
Below are some of mine. Remember the first one in 2019 was onset of ME/CFS and it has since moved much closer to recovery (but not all of the way there). uBiome does provide a Diversity number, but it is a black box. I opted to count the number at each taxonomic level instead and then show as a percentile compared to other uploaded samples.
It was interesting that ME/CFS signature shows up at the species level best. A ton of new species appeared with onset.
ME/CFS caused 43% more species to appear than my healthy references
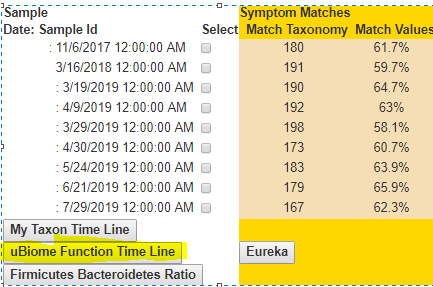
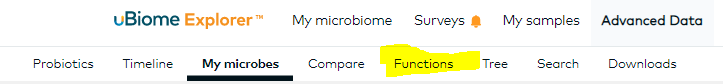
Since the original #6 report, I have entered from the uBiome site, the predicted metabolic function values for my samples (in the new entry form) and coded up a timeline view. It has been pushed to the site. NOTE: This comes from the uBiome site and is not available from other 16s test providers. There are 105 different functions reported by uBiome.
To get the charts you must TRANSCRIBE the data from ubiome. Otherwise you will see nothing. See this post.
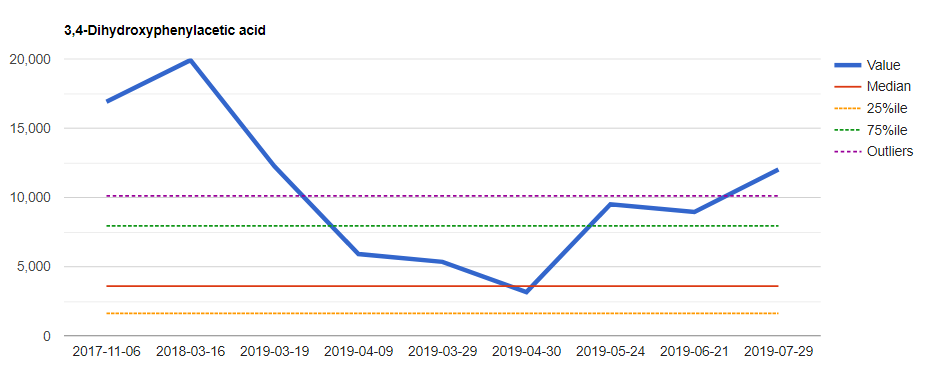
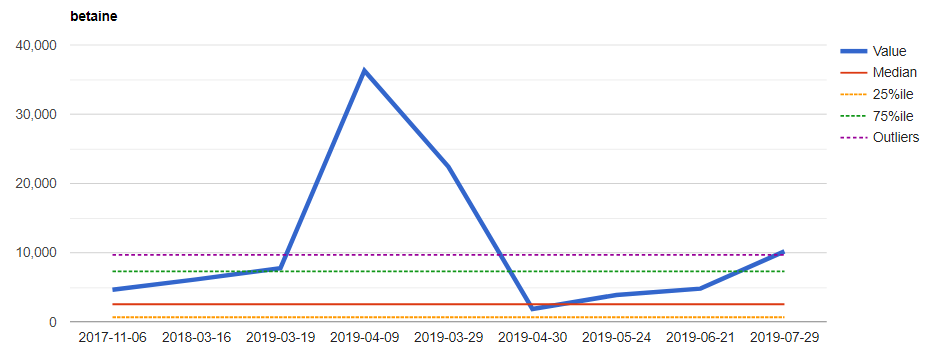
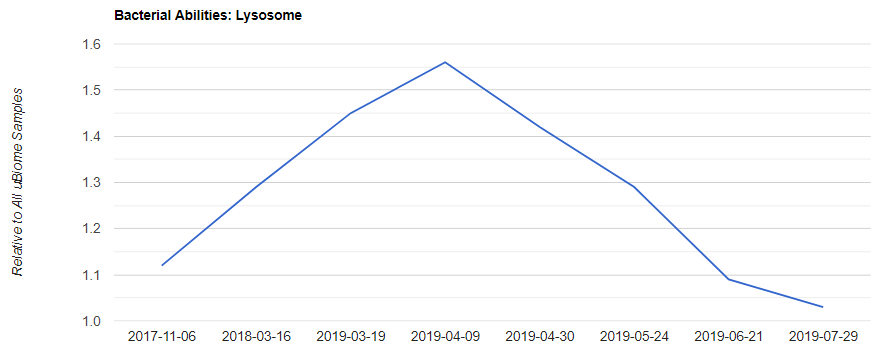
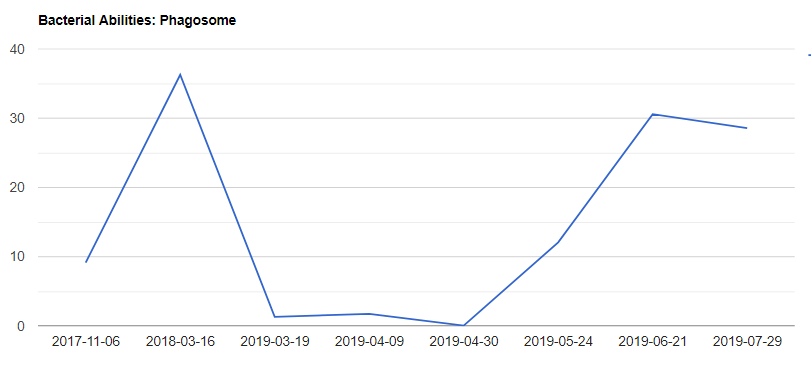
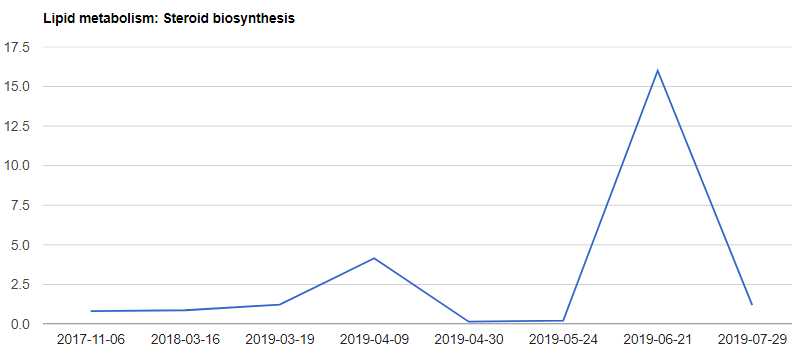
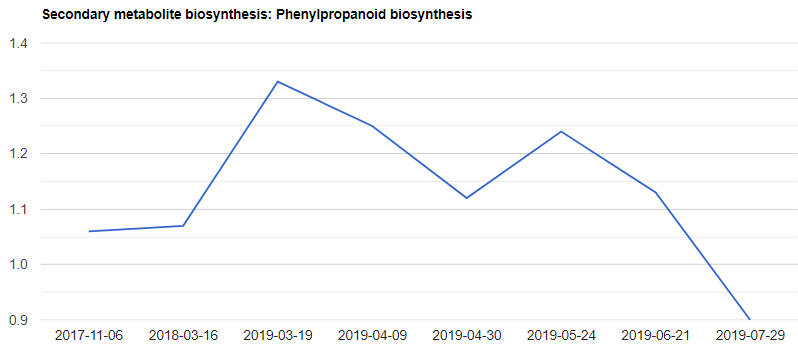
This post looks at the most interesting charts. The 2017/2018 values are PRE-RELAPSE and show the normal values for me.
Historically, I run high on this value — it collapsed and then slowly recovered.This may be connected to ongoing fatigue. It is 4x higher than prior to relapse.A lot of major jumping around on this one
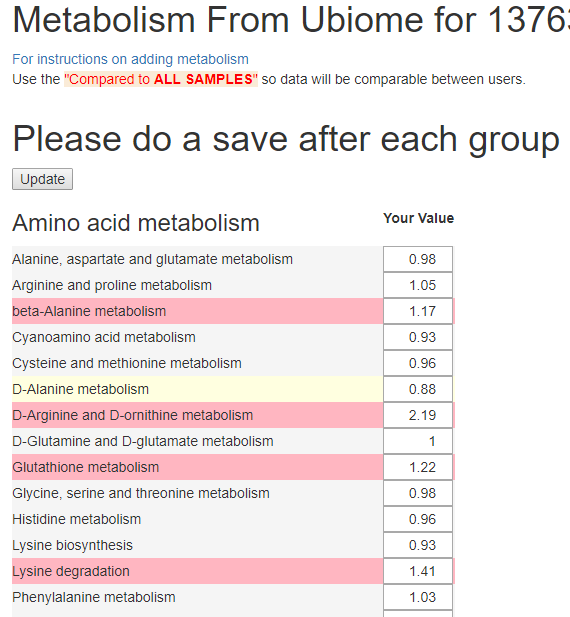
I have just revised the metabolism entry form for ubiome data to allow entering the specific value as shown below. ( http://microbiomeprescription.com/ )This makes data more meaningful and useful for citizen science analysis. By the end of day, I should have added the ability to view the Metabolism function over time (just like you can view individual taxon over time). While ubiome does have a display — it is very busy.
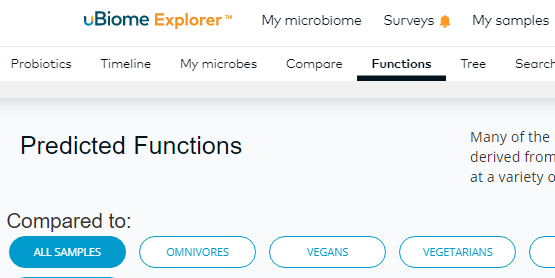
How to get to the data (use ALL SAMPLES always)
So get your data updated and enjoy the new charts!