
A reader sent me over two uBiomes taken 3 months apart and was confused by the results. Fortunately, I could upload her data and do some quick analysis (which will eventually be available as a web page).
Phylum Level Is Improving
The numbers below are the counts. It they are getting closer to normal, it is improving. If further away then a loss.
| October | December | Normal | tax_name | tax_rank | Change |
| 15453 | 10574 | 45026 | Actinobacteria | phylum | Loss |
| 701911 | 424855 | 271874 | Bacteroidetes | phylum | Improved |
| 60 | 9124 | 38 | Euryarchaeota | phylum | Loss |
| 269622 | 527597 | 561301 | Firmicutes | phylum | Improved |
| 12694 | 22898 | 32511 | Proteobacteria | phylum | Improved |
| 271 | 512 | 4200 | Synergistetes | phylum | Improved |
We see a rare phylum (Euryarchaeota) was one of the two losses, so we really had 4 gains to 1 loss.
Class Changes
The dominant change at the class level are improvement if we take by raw counts. Both Clostridia and Bacteroidia (the two biggest classes have improved). The third largest class Erysipelotrichia has had a loss.
| October | December | Normal | tax_name | tax_rank | Change |
| 15453 | 10574 | 45026 | Actinobacteria | class | Loss |
| 120 | 3024 | 24677 | Alphaproteobacteria | class | Improved |
| 15544 | 8799 | 20967 | Bacilli | class | Loss |
| 701911 | 424855 | 270991 | Bacteroidia | class | Improved |
| 527 | 12086 | 12351 | Betaproteobacteria | class | Improved |
| 221346 | 469302 | 511846 | Clostridia | class | Improved |
| 1191 | 6249 | 3903 | Deltaproteobacteria | class | Improved |
| 5367 | 1337 | 7271 | Epsilonproteobacteria | class | Loss |
| 15785 | 36597 | 10249 | Erysipelotrichia | class | Loss |
| 5488 | 199 | 24696 | Gammaproteobacteria | class | Loss |
| 60 | 9124 | 38 | Methanobacteria | class | Loss |
| 16946 | 12899 | 24121 | Negativicutes | class | Loss |
For this overgrowth, we have some suggestions.
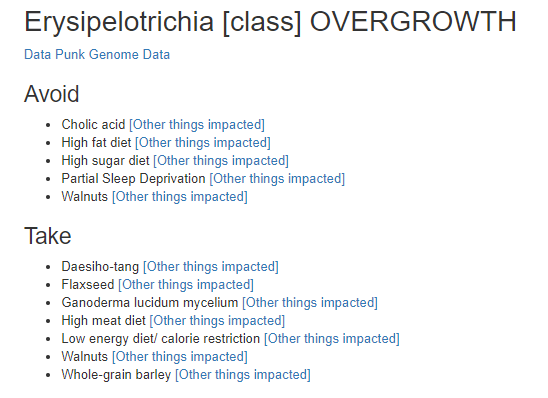
NOTE: Walnut is reported at two places. We have contrary results from studies 😦
Order Changes
We see gain and loss here too.
| October | December | Normal | tax_name | tax_rank | Change |
| 5261 | 2899 | 23920 | Actinomycetales | order | Loss |
| 346 | 249 | 15243 | Bacillales | order | Loss |
| 701911 | 424855 | 268676 | Bacteroidales | order | Improved |
| 527 | 11974 | 11721 | Burkholderiales | order | Improved |
| 5367 | 1337 | 7271 | Campylobacterales | order | Loss |
| 221346 | 468964 | 512463 | Clostridiales | order | Improved |
| 2140 | 7674 | 21896 | Coriobacteriales | order | Improved |
| 1191 | 6249 | 3544 | Desulfovibrionales | order | Loss |
| 15785 | 36597 | 10192 | Erysipelotrichales | order | Loss |
| 15197 | 8549 | 19016 | Lactobacillales | order | Loss |
| 60 | 9124 | 38 | Methanobacteriales | order | Loss |
| 180 | 199 | 6984 | Pasteurellales | order | Improved |
| 120 | 24 | 41600 | Rhizobiales | order | Loss |
| 16946 | 12899 | 24121 | Selenomonadales | order | Loss |
| 271 | 512 | 4200 | Synergistales | order | Improved |
The worst loss was for Rhizobiales, with the following suggestions coming from the website

It is now clear that walnuts should be avoided.
Bottom Line
One concern that I have asked is about undergrowth. Working at the genus level gets very complex here. Working at higher levels like phylum, class and order is simpler.
With this new comparison page proposed, you get better clarity of the numbers and can focus on the highest count targets.
This is an education post to facilitate discussing this approach with your medical professionals. It is not medical advice for the treatment of any condition. Always consult with your medical professional before doing any changes of diet, supplements or activity. Some items cites may interfere with prescription medicines.
