
I have programmed (and hopefully improved) my process for analysis of uBiomes. It is still being debugged (and I doing a few of my backlog to test it).
See your Microbiome shifts in a tree
This allows a much clearer view of where hotspots of overgrowth are occurring.
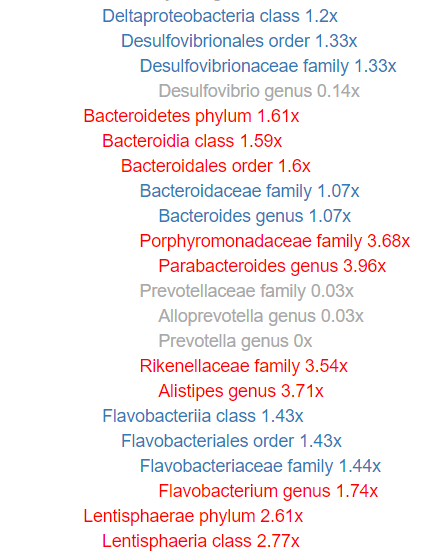
The factor shown are NOT from ubiome, but from my estimates (which will evolve). So what are uBiomes numbers?
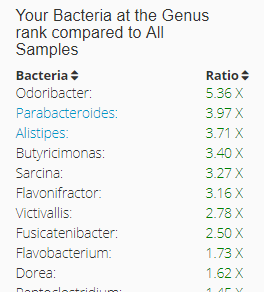
We are close, very close (1.74 vs 1.73, 3.71 vs 3.71, 3.96 vs 3.97).
All of the bacteria levels are hyperlinked to more information about each.
Recommendations
Recommendations are often increased and there can be some conflicts. For example, Walnuts, High Fat Diet, Vitamin D. This is because different bacteria reacts differently.
Learning More
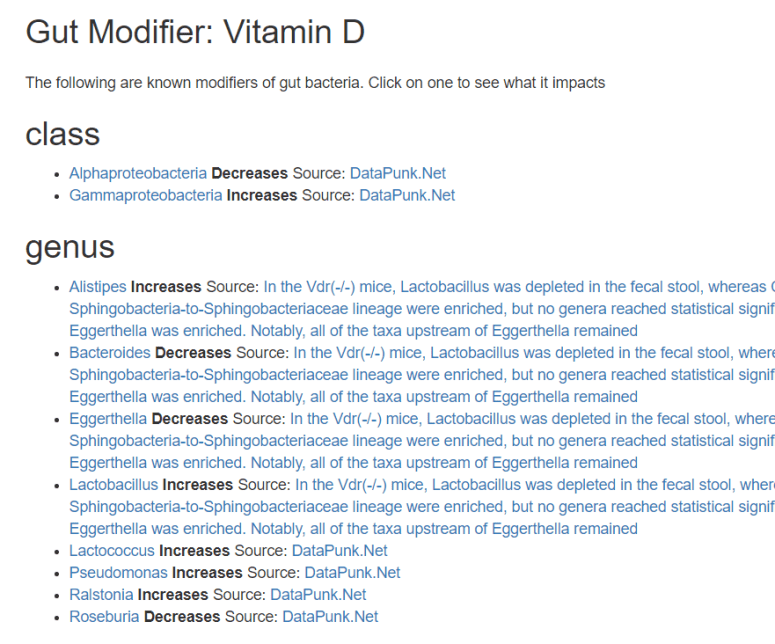
Clicking on an item like Vitamin D, will show you what we know that vitamin D changes (with the source of information)
Bottom Line
The new do-the-analysis yourself site does a deeper evaluations of each item and their impact with full transparency to the data source.
I hope to have public uploads enabled within the week. There is a lot of data to be added to it, so it may be a month or more before that is complete. DataPunk data is complete — so there is a reasonable amount of data now (i.e. for the above, we have a long list of items suggested already).
If there are too many items, just go for the ones with the highest weights.
