
Some one who been following the recommendations from http://microbiomeprescription.com/ just uploaded their latest (march, 2018) results and asked me too look at the changes. I did this earlier when I first created the page to compare: Comparing repeated uBiome results and the first study Simple Summary of Progress between uBiome Samples
Total for all AutoImmune like Profiles
Decreased from 127 to 116. Most significant was metabolic syndrome dropping from 8 factors to 3 factors. Chronic Fatigue Syndrome dropped from 18 factors to 15 factors.
On the other side, ADHD factors increased from 6 to 11, which agrees with the observed lost of focus.
Metabolism (KEGG) has improved
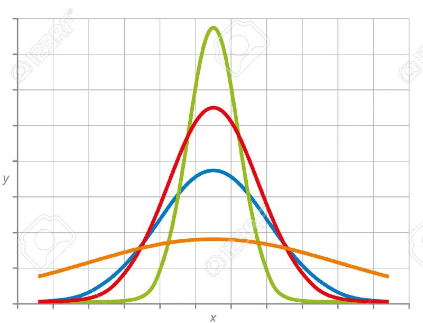
Std Dev is the measure of how scattered the results are around normal. If every result was 1.0 then Std Dev would be 0.0.
- 0.47 would be like the red line below
- 0.23 would be like the green line below
| Metabolism Average | Sept 2017 | March 2018 |
|---|---|---|
| Metabolism Average | 1.03 | 1.00 |
| Metabolism Std Dev | 0.47 | 0.23 |
Detail Changes
The following went up or down significantly
| Secondary metabolite degradation: Fluorobenzoate degradation | 0.575 | 0.3 |
| Secondary metabolite biosynthesis: Stilbenoid, diarylheptanoid and gingerol biosynthesis [POST} | 2.5 | 1.8 |
| Secondary metabolite biosynthesis: Caffeine metabolism | 1 | 0.575 |
| Secondary metabolite biosynthesis: Betalain biosynthesis | 0.3 | 1.425 |
| Lipid metabolism: alpha-Linolenic acid metabolism | 1.175 | 0.575 |
| Lipid metabolism: Arachidonic acid metabolism | 0.825 | 0.575 |
The above lead to some suggestions:
- Alpha lipoic Acid supplements
- Ginger – Ginger Blood Thinner Properties
- Turmeric – Turmeric Blood Thinner Properties
- Resveratrol– The most common Blood Thinners
- Almonds – Almond as a Blood Thinner
- Arachidonic acid supplements (a.k.a. Peanuts)
Bacteria Shifts
This is the percentage from the normal ranges that I have been using. We see several phylum (high level of bacteria) has moved from very low to the normal range as the Bacteroides/Firmicutes ratio has also shifted.
| (phylum)Actinobacteria | -1 % | -15 % |
| (phylum)Bacteroidetes | 0 % | 31 % |
| (phylum)Firmicutes | 7 % | -14 % |
| (phylum)Fusobacteria | -72 % | -97 % |
| (phylum)Proteobacteria | 0 % | 25 % |
| (phylum)Synergistetes | -91 % | 0 % |
| (phylum)Verrucomicrobia | -97 % | 0 % |
Visuals
At the class level, we see that a lot of classes have increased in side, which I view as a good thing.

Recommendations
With the new recommendation engine, we had 12 items on default recommendations with the former sample, and only 1 item for the latest sample (high counts). When we switched to the low counts ONLY for current sample, we get a long list. A few examples below:
| Item | Action | Confidence value |
|---|---|---|
| beta-glucan foods | Take | 5.734 |
| mediterranean diet | Take | 5.353 |
| barley | Take | 4.68 |
| dairy milk fats | Take | 3.13 |
| almonds | Take | 3.06 |
| pulse / legumes | Take | 2.786 |
| lactobacillus reuteri probiotics | Take | 2.742 |
| arabinoxylan | Take | 2.556 |
| raffinose foods | Take | 2.476 |
| inulin prebiotics | Take | 2.467 |
| coconut products | Take | 2.402 |
| bacillus probiotics | Take | 2.331 |
| high fiber diet | Take | 2.277 |
| candida albicans yeast | Take | 2.131 |
| bifidobacterium animalis lactis probiotic | Take | 1.98 |
| bacillus subtilis probiotic | Take | 1.859 |
| pomegranate fruit | Take | 1.804 |
| fruit | Take | 1.702 |
| whole grains | Take | 1.642 |
| walnuts nuts | Take | 1.491 |
| bacillus licheniformis probiotics | Take | 1.447 |
| vitamin a retinol | Take | 1.425 |
Bottom Line
This is the second comparison that I have done [earlier one], and both had KEGG (Metabolites) improving and other improvements.
Modifying the microbiome is a complex area — do you reduce the high first, increase the low, try doing both at the same time?
The key take away is that “Yes Virginia, you can alter and improve your microbiome”. After altering it one way, the next ubiome sample may result in major changes of what to take. It is NOT a straight linear path.
This is an education post to facilitate discussing this approach with your medical professionals. It is not medical advice for the treatment of any medical condition. Always consult with your medical professional before doing any changes of diet, supplements or activity. Some items cites may interfere with prescription medicines.
