
Over the last week, I have been expanding the end product analysis. The main reason is that the first iteration found very strong clustering of end products with patients that had certain symptoms.
A visual may help:
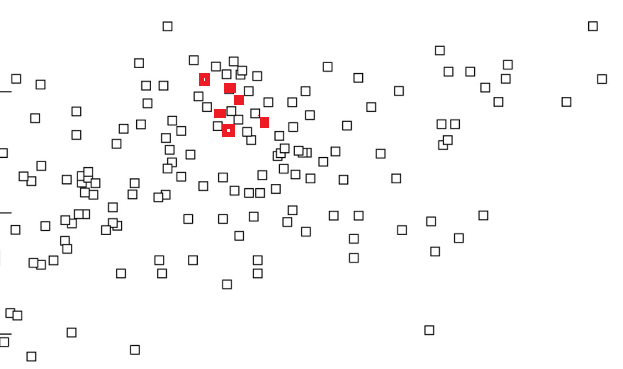
If you take all of the points and look at the red averages using the standard deviation of all of the points, it would not be significant. If you took the red average and red standard deviation and compare to the average for all of the points — you will get statistical significance. Something that you can see visually above.
This post refers to the site: http://microbiomeprescription.com/ If you have a thryve or ubiome analysis, you can upload it there and get further analysis done.
Personal Comparison
I have added some new columns to the page for comparison to people reporting themselves as healthy.
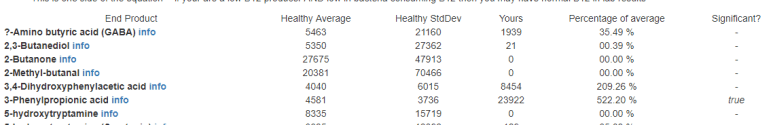
As you can see above, you may have a very low or very high percentage and it is not deemed significant using the health population average and standard deviation.
If you go over to the symptom explorer, and add in a symptom, i.e. Neurological-Sleep: Night Sweats , you will see discover some items are missing… for example: 2-Methyl-butanal and 2-Butanone
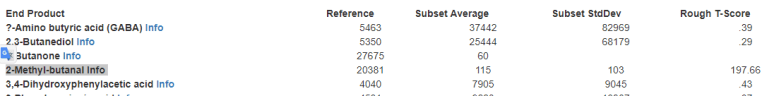
You will also note that people with this condition are VERY LOW … having zero is not unexpected.
Bottom Line
There are now some 80 end products being reported now using more information about which bacteria produces each product.
This does not always give simple suggestions… in a few cases, it does — a specific Vitamin or amino acid is low. When dealing with high levels, that is more complex because it means killing off some bacteria 😦 .
