
The human microbiome changes easily even when there is an illness. The bacteria associated with an illness are often from a collection of compatible bacteria — so you may have subset A this week and subset B next week.
To illustrate this, prior to the ME/CFS relapse, my blood pressure tended to be around 120/80. Having ME/CFS with all of the associated issues, makes BP a measure prone to wild fluctuations at time. See these earlier posts:
- The Heart and Blood of the CFS Patient You may have a small heart
- The Heart and Blood of CFS
- Blood Pressure and CFS-IBS-FM
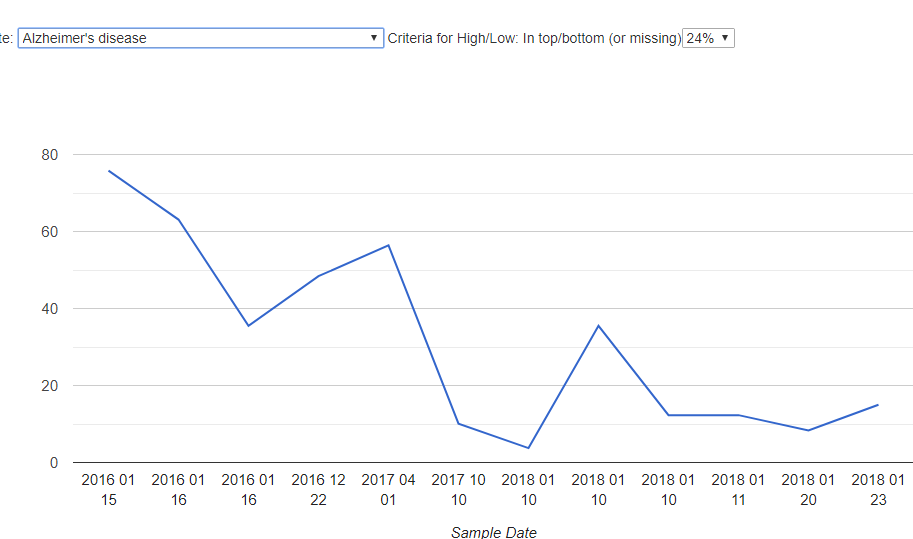
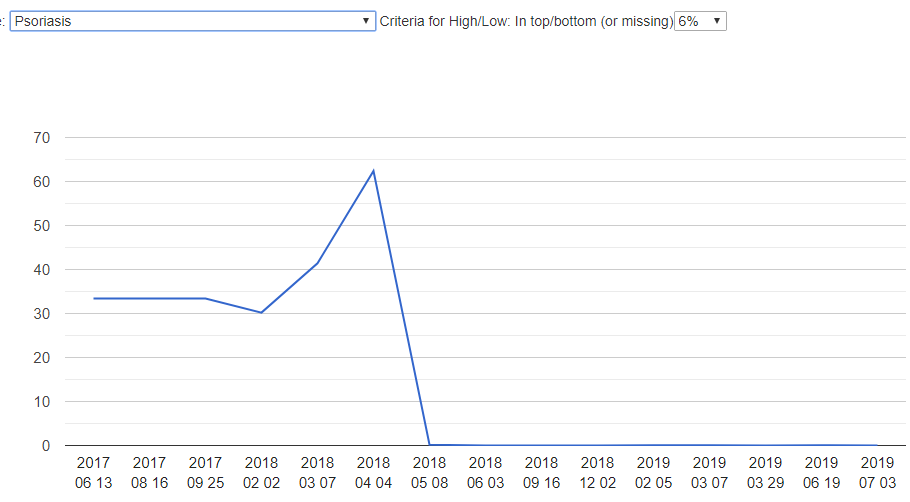
My recent visit to an urgent care has the physician concerned about high blood pressure. Usually, I have not been concerned about that because I have had a history of low BP with POTS. With the recent work on symptom templates (see this post), I wrote a time plot page to plot the pearson chi-square probability over time of each one of our many disease profiles.
I then looked at the blood pressure one for myself:
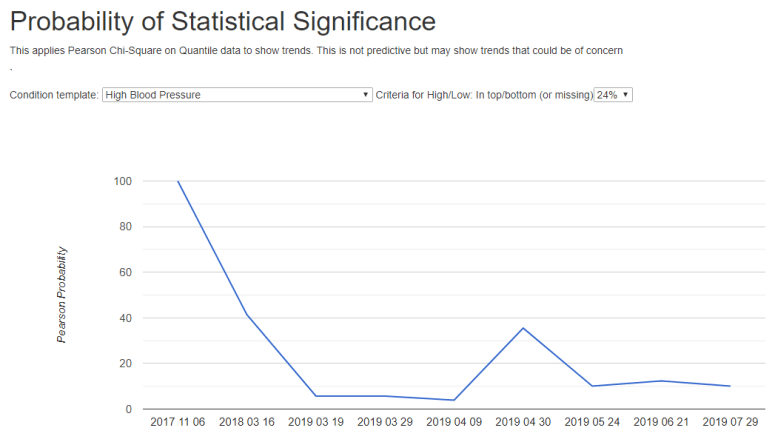
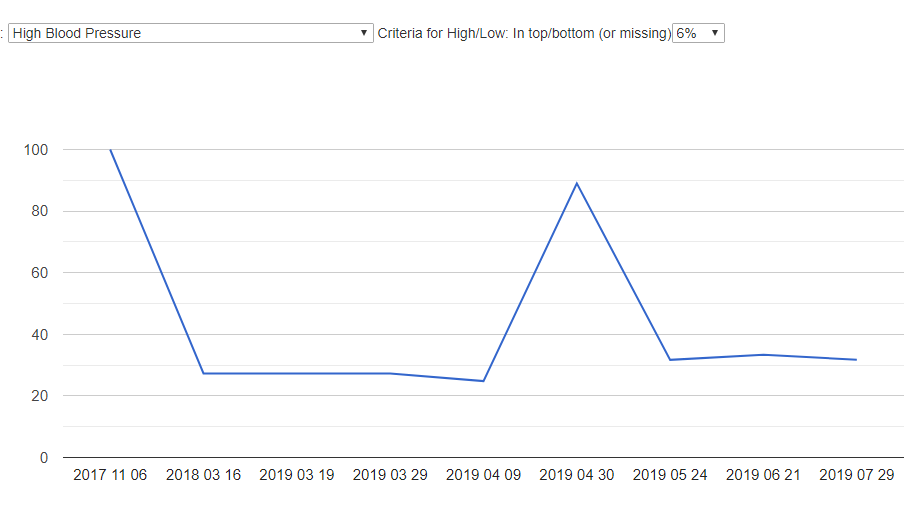
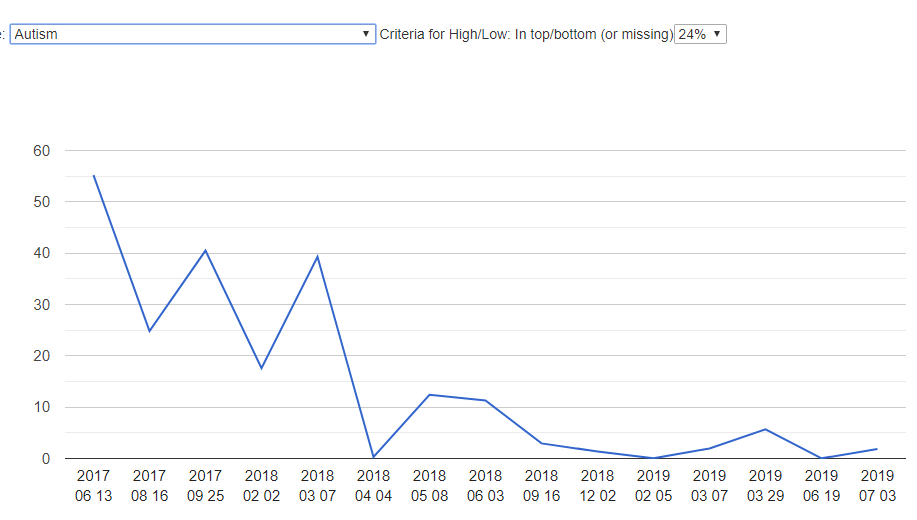
There is definitely some art in using this. The Criteria takes some playing with to see patterns (remember the studies indicate a change of average values, not extreme values … so 24% may be better than 6% for some conditions).
For those who missed the prior post that explains how these numbers are calculated, see this post with video.
What are we looking for?
We are looking a pattern that repeats pretty constantly over several samples taken a few weeks or months apart.
I have done a video rambling on this new feature.
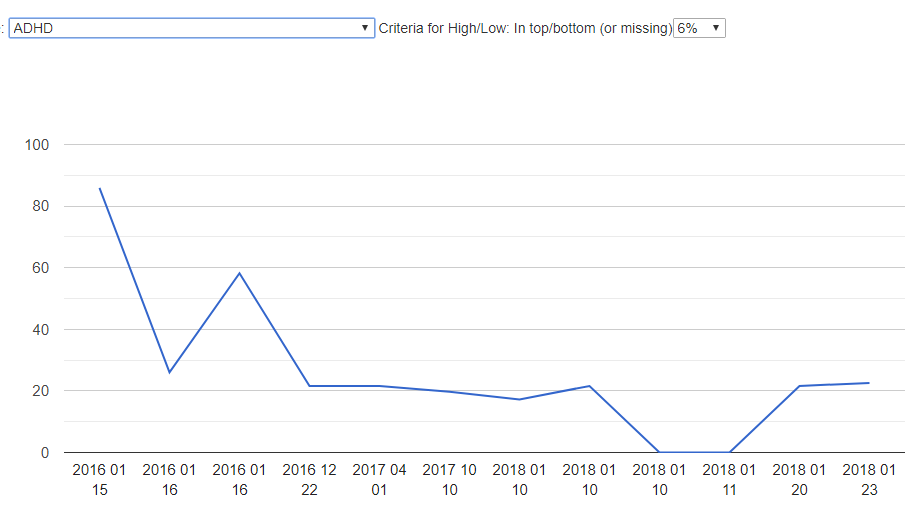
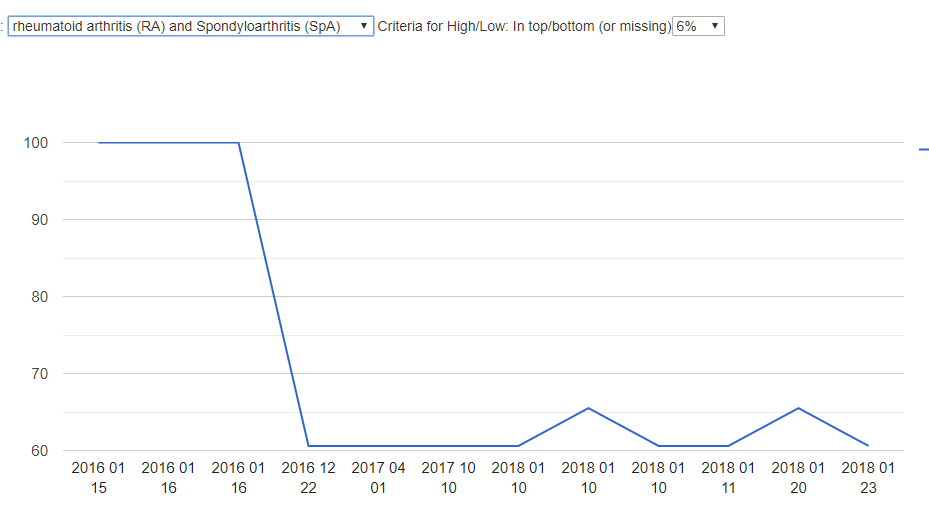
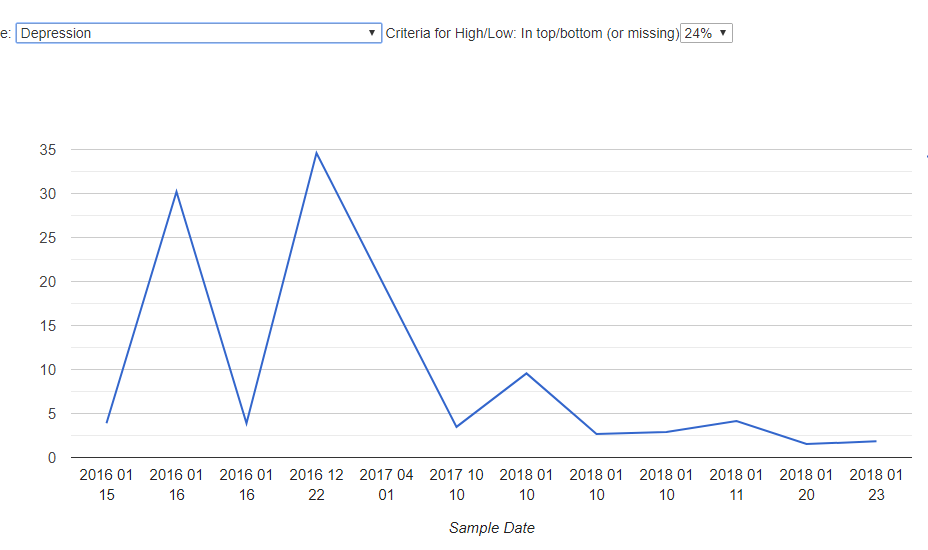
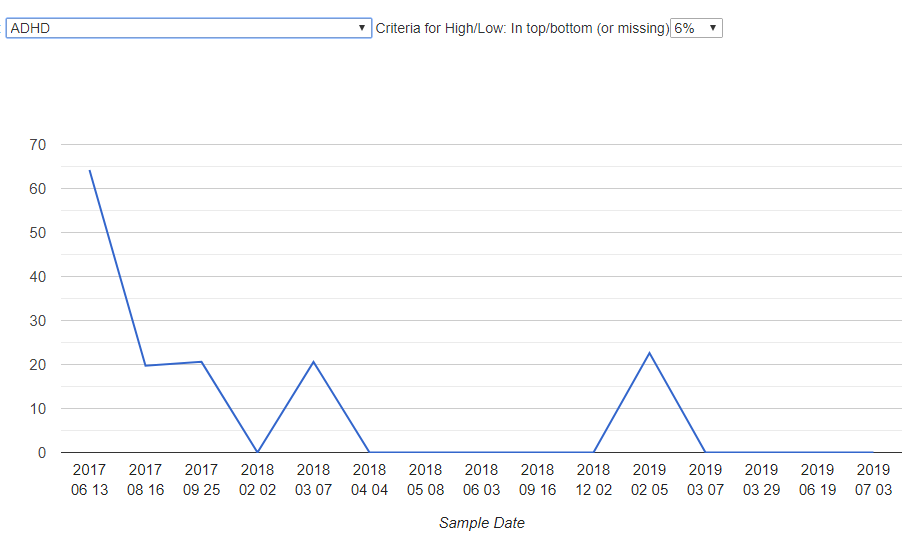
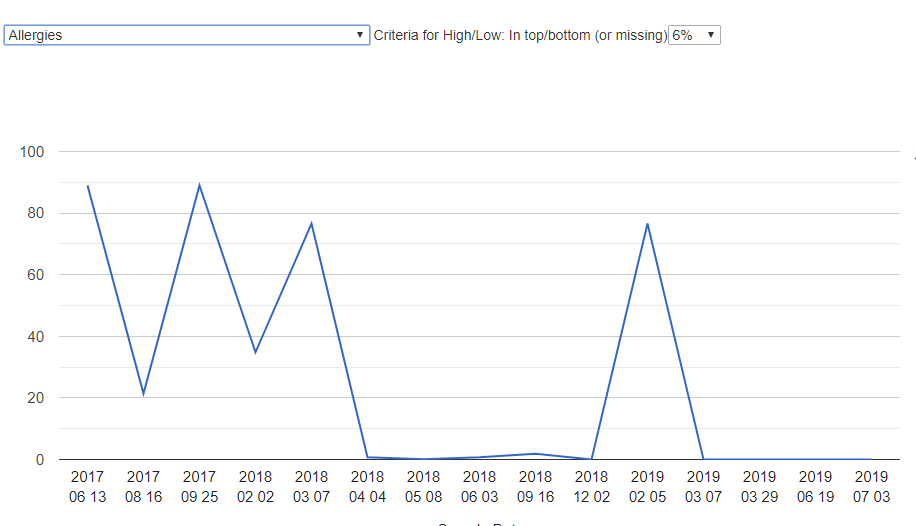
A few more examples:

Bottom Line
This tool may be useful as you build up samples over time. Often one sample gets odd numbers and we have a spike with before and after samples showing a constant pattern.
If you are interested, consider investing in multiple samples. I usually use a discount code and get uBiome’s 3-pack for around $150 … that’s $50 per result (which is often what a good bottle of probiotics cost).
