First, apologies to people over the microbiome prescription site being up, then down, then up, then down. The hosting company that I am using (and 900,000 other customers!) having been dealing with issues with their cloud provider. As I write this on Saturday, March 8th 2025, evening — it is back up.
Today, I reworked some old page concepts, improving the mathematics and the presentation. The purpose is to give you some ideas of where your ME/CFS or Long COVID may progress. By progress, I mean symptoms that may get added to your already massive list.
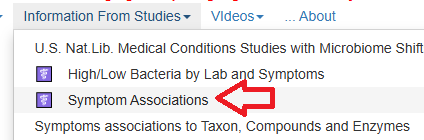
This will show a page with no symptoms/characteristics entered.
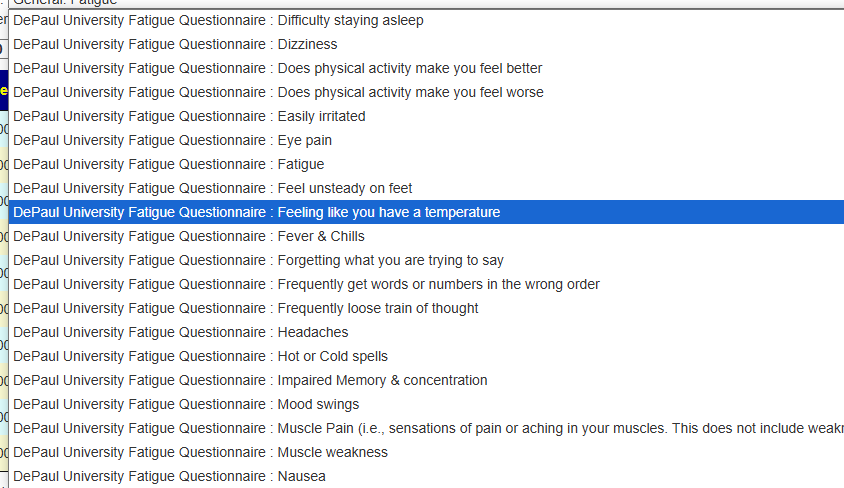
Enter the most critical symptom that you have. For this example, I will do long COVID. Just enter it in the Search box until you see what you are interested in
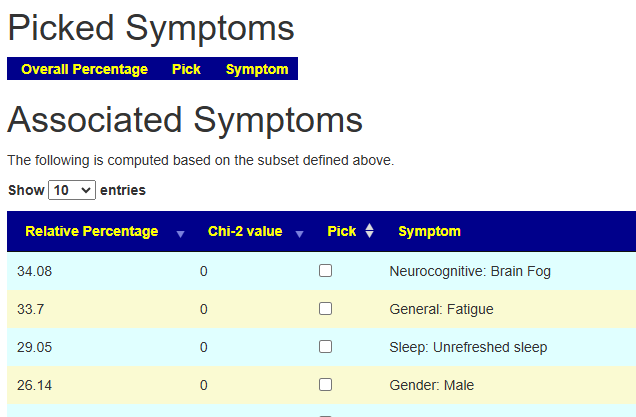
Check the Check box and the page will refresh. You will see that 11.7% of the samples report Long Covid. Below it are the OTHER symptoms that these people report — with the percentage that reports each symptom
We will pick POTS next. The page will update. Note that Post exertional Malaise that was 26% chance above jumps to 67%. Having POTS with Long COVID increases the odds.
Adding in General Headaches, increases Brain Fog to 84% chance. If you do not have Brain Fog at the moment, there is a very good chance that you will get it.
Bottom Line
The purpose of this tool is give concrete odd of what your next symptoms may be. Here’s a walk through.
For any one that is interested, bacteria with P < 0.005 significance to 324 symptoms and diagnosis is now available (with source data) at https://microbiomeprescription.com/sample/Frequency Some items of interest to the ME/CFS Community are below
Metabolites are substances made or used in the body during metabolism, which is the process of breaking down food or chemicals into energy and other useful materials. They help the body grow, repair itself, and function properly. Examples include amino acids, vitamins, and sugars.
Example for ME/CFS
In Myalgic Encephalomyelitis/Chronic Fatigue Syndrome (ME/CFS), metabolites have been found to play a critical role in understanding the disease’s mechanisms and symptoms:
Gut Microbiome and Butyrate: ME/CFS is associated with changes in gut bacteria, leading to reduced levels of butyrate, a metabolite produced by certain gut microbes. Butyrate supports gut health, immune regulation, and energy production. Reduced butyrate levels in ME/CFS patients are linked to fatigue severity and inflammation.
Energy Metabolism: Studies reveal abnormalities in pathways like fatty acid metabolism, glucose metabolism, and the citric acid (TCA) cycle in ME/CFS patients. These changes suggest impaired cellular energy production, contributing to chronic fatigue.
Amino Acid Metabolism: Altered tryptophan metabolism and disruptions in the kynurenine pathway have been observed, which may affect immune function and contribute to neurocognitive symptoms through the gut-brain axis.
Plasma Metabolites: ME/CFS patients exhibit differences in plasma metabolites compared to healthy controls, particularly after physical exertion. These include disruptions in glutamate metabolism, which may impact recovery and exacerbate symptoms.
Disease Subtypes: Metabolomic studies have identified distinct metabolic profiles among ME/CFS patients, suggesting subtypes with different clinical presentations and underlying mechanisms.
These findings highlight the importance of metabolites in ME/CFS research, offering potential biomarkers for diagnosis and targets for therapeutic interventions.
Example for IBS
In the context of Irritable Bowel Syndrome (IBS), metabolites play a significant role:
Gut microbiota-derived metabolites: These are substances produced by the bacteria in our intestines and are thought to be involved in IBS symptoms. Some important examples include:
Bile acids
Short-chain fatty acids
Vitamins
Amino acids
Serotonin
Hypoxanthine
Blood metabolites: Certain metabolites in the blood have been found to have a causal relationship with IBS. For example:
Stearate: Associated with decreased susceptibility to IBS
Arginine: Associated with increased risk of IBS
1-palmitoylglycerol: Associated with increased risk of IBS
Fecal metabolites: Studies have identified specific fecal metabolite profiles in IBS patients that differ from healthy individuals. These metabolites are often amino acids or fatty acids.
Brain-gut interaction: Some metabolites, particularly amino acids like tryptophan, glutamate, and histidine, may influence brain function in IBS patients5. They could affect brain connectivity either directly by crossing the blood-brain barrier or indirectly through peripheral mechanisms.
Understanding these metabolites and their interactions with the gut microbiome may provide valuable insights into the underlying mechanisms of IBS and potentially lead to new diagnostic tools or treatments.
Enzymes Role to Metabolites
Enzymes play a crucial role in managing metabolites within our bodies. Here’s a simple description of their relationship:
Enzymes are proteins that act as biological catalysts7. They speed up chemical reactions in our cells without being used up themselves.
Metabolites are substances produced or used during metabolism1. They can be small molecules like sugars, amino acids, or fatty acids.
Enzymes help break down large molecules (like proteins, fats, and carbohydrates) into smaller metabolites. This process is essential for digestion and energy production.
Enzymes also help build larger molecules from smaller metabolites. This is important for creating cellular structures and storing energy.
Each enzyme typically works on specific metabolites, called substrates1. The enzyme and substrate fit together like a lock and key.
By controlling which reactions happen and how quickly, enzymes regulate the levels of various metabolites in our bodies. This helps maintain balance and allows cells to respond to changing needs.
In essence, enzymes are the workers that manage metabolites, ensuring our bodies can efficiently use the food we eat and carry out the chemical processes necessary for life.
Data From Samples Uploaded with ME/CFS
It happens that from uploaded samples and KEGG: Kyoto Encyclopedia of Genes and Genomes; we can determine that the following enzymes are (VERY VERY) statistically significant. The most significant ones are all too high. The top ones comes from the three genus only: Chlorobaculum , Pelodictyon and Prosthecochloris
Chlorobaculum limnaeum
Chlorobaculum parvum
Chlorobaculum tepidum
Chlorobium chlorochromatii
Chlorobium limicola
Chlorobium phaeobacteroides
Chlorobium phaeovibrioides
Chloroherpeton thalassium
Pelodictyon luteolum
Pelodictyon phaeoclathratiforme
Prosthecochloris aestuarii
Prosthecochloris sp. CIB 2401
Prosthecochloris sp. GSB1
Prosthecochloris sp. HL-130-GSB
Some (but not all) enzymes can be provided by some probiotics. Below is recent feedback from a person dealing with a child’s autism.
This is an update of my post from 10 years ago, CFS: Appropriate Brain Scans. I will focus on studies in those 10 years. Short version of these studies below.
Data showed that MRI studies frequently reported structural changes in the white and gray matter. Abnormalities of the functional connectivity within the brainstem and with other brain regions have also been found. The studies have suggested possible mechanisms including astrocyte dysfunction, cerebral perfusion impairment, impaired nerve conduction, and neuroinflammation involving the brainstem, which may at least partially explain a substantial portion of the ME/CFS symptoms and their heterogeneous presentations in individual patient Brainstem Abnormalities in Myalgic Encephalomyelitis/Chronic Fatigue Syndrome: A Scoping Review and Evaluation of Magnetic Resonance Imaging Findings [2021]
In our family dealing with ME/CFS, we were fortunate is having brain scans done by and interpreted by Doctor Daniel Amen. Our effective treatment was focused on shifting bacteria, addressing coagulation, and reducing inflammation.
For more information on metabolites, see this post.
Hippocampal subfield volume alterations and associations with severity measures in long COVID and ME/CFS: A 7T MRI study [2025] “we found significant associations between hippocampal subfield volumes and severity measures of ‘Pain’, ‘Duration of illness’, ‘Severity of fatigue’, ‘Impaired concentration’, ‘Unrefreshing sleep’, and ‘Physical function’ in both conditions. These findings suggest that hippocampal alterations may contribute to the neurocognitive impairment experienced by long COVID and ME/CFS patients.”
Hypothalamus Connectivity in Adolescent Myalgic Encephalomyelitis/Chronic Fatigue Syndrome [2024] “We observed weak-to-moderate evidence of increased degree, but not strength, of connections from the bilateral anterior-inferior (left: pd [%] = 99.18, median [95% CI] = -22.68[-40.96 to 4.45]; right: pd [%] = 99.86, median [95% CI] = -23.35[-38.47 to 8.20]), left anterior-superior (pd [%] = 99.33, median [95% CI] = -18.83[-33.45 to 4.07]) and total left hypothalamus (pd [%] = 99.44, median [95% CI] = -47.18[-83.74 to 11.03]) in the ME/CFS group compared with controls. Conversely, bilateral posterior hypothalamus degree decreased with increasing ME/CFS illness duration (left: pd [%] = 98.13, median [95% CI]: -0.47[-0.89 to 0.03]; right: pd [%] = 98.50, median [95% CI]:-0.43[-0.82 to 0.05]). Finally, a weak relationship between right intermediate hypothalamus connectivity strength and fatigue severity was identified in the ME/CFS group (pd [%] = 99.35, median [95% CI] = -0.28[-0.51 to 0.06]), which was absent in controls. These findings suggest changes in hypothalamus connectivity may occur in adolescents with ME/CFS, warranting further investigation.”
Brain-regional characteristics and neuroinflammation in ME/CFS patients from neuroimaging: A systematic review and meta-analysis [2023] “These abnormalities, occurring in pivotal network hubs bridging reason and emotion, disrupt connections with the limbic system, contributing to the hallmark symptoms of ME/CFS. Furthermore, we discuss the regions where neuroinflammatory features are frequently observed and address critical neuroimaging limitations, including issues related to inter-rater reliability. This systematic review serves as a valuable guide for defining regions of interest (ROI) in future neuroimaging investigations of ME/CFS.”
What lies beneath: White matter microstructure in pediatric myalgic encephalomyelitis/chronic fatigue syndrome using diffusion MRI [2023] “our findings suggest that white matter abnormalities may not be predominant in pediatric ME/CFS in the early stages following diagnosis. The discrepancy between our null findings and white matter abnormalities identified in the adult ME/CFS literature could suggest that older age and/or longer illness duration influence changes in brain structure and brain-behavior relationships that are not yet established in adolescence.”
Volumetric differences in hippocampal subfields and associations with clinical measures in myalgic encephalomyelitis/chronic fatigue syndrome [2022] “we detected positive correlations between fatigue and hippocampus subfield volumes and a negative correlation between sleep disturbance score and the right CA1 body volume. In ME/CFSICC patients, we detected a strong negative relationship between fatigue and left hippocampus tail volume. Strong negative relationships were also detected between pain and SF36 physical scores and two hippocampal subfield volumes (left: GC-ML-DG head and CA4 head). Our study demonstrated that volumetric differences in hippocampal subfields have strong statistical inference for patients meeting the ME/CFSICC case definition and confirms hippocampal involvement in the cognitive and memory problems of ME/CFSICC patients.”
Limbic Perfusion Is Reduced in Patients with Myalgic Encephalomyelitis/Chronic Fatigue Syndrome (ME/CFS) [2021] ” the patient group showed significant hypoperfusion (uncorrected voxel wise p ≤ 0.001, FWE p ≤ 0.01) in several brain regions of the limbic system, including the anterior cingulate cortex, putamen, pallidum, and anterior ventral insular area. For the ME/CFS patients, the overall symptom severity score at rest was significantly associated with a reduced rCBF in the anterior cingulate cortex. The results of this study show that brain blood flow abnormalities in the limbic system may contribute to ME/CFS pathogenesis.”
Neuroimaging markers of chronic fatigue in older people: a narrative review [2021] “Fatigue was associated with reduced hippocampus volumes and with hippocampal amyloid deposition. Regarding the association between fatigue and the circuit of basal ganglia, putamen and thalamus were associated with physical fatigability, whereas amygdala and thalamus with mental fatigability”
Intra brainstem connectivity is impaired in chronic fatigue syndrome [2019] “In ME/CFS, connections were absent between medulla and midbrain nuclei, although hippocampal connections with these nuclei were enhanced. When corresponding correlations from HC and ME/CFS were compared, ME/CFS connectivity deficits were detected within the brainstem between the medulla and cuneiform nucleus and between the brainstem and hippocampus and intralaminar thalamus, but only during task. “
Hyperintense sensorimotor T1 spin echo MRI is associated with brainstem abnormality in chronic fatigue syndrome [2018] “the T1wSE group comparison detected decreased signal-levels in CFS in a brainstem region (cluster-based inference controlled for family wise error rate, PFWE= 0.002), and increased signal-levels in large bilateral clusters in sensorimotor cortex white matter (cluster PFWE < 0.0001). Moreover, the brainstem T1wSE values were negatively correlated with the sensorimotor values for both CFS (R2 = 0.31, P = 0.00007) and healthy controls (R2 = 0.34, P = 0.0009), “
Grey and white matter differences in Chronic Fatigue Syndrome – A voxel-based morphometry study [2017] “patients had larger GM volume and lower WM volume. The voxel-wise analysis showed increased GM volume in several structures including the amygdala and insula in the patient group. Reductions in WM volume in the patient group were seen primarily in the midbrain, pons and right temporal lobe.”
Chronic fatigue syndrome in women assessed with combined cardiac magnetic resonance imaging [2016] “In patients with CFS, CMR demonstrated lower LV dimensions and a mildly reduced LV function. The presence of myocardial fibrosis in some CFS patients suggests that CMR assessment of cardiac involvement is warranted as part of the scientific exploration, which may imply serial non-invasive examinations.”
The process is very simple, for a condition like ME/CFS, we compute the expected number of samples reporting this bacteria (based on people without Long COVID) and compare it to the actual number seen. This can be used to compute a statistical value called Chi-Square (χ²), This is then used to compute the chance of it happening at random. This is possible because we have over 3600 samples from some labs and thus able to detect things better.
Actual example:
Prevotella denticola – Species reported by Ombre
Expected to see 3.6
Actually seen 27
In other words almost 4x more common than expected. The probability is
4.9E-34
or 1 chance in 2,000,000,000,000,000,000,000,000,000,000,000 of happening at random.
This suggests that we should reduce it to remedy ME/CFS [with the other bacteria involved]
Biomesight and Ombre identifies bacteria using different methodologies so often give different names and amounts. For background on this lack of standardization, see The taxonomy nightmare before Christmas…
The data below is for samples marked with “Official Diagnosis: Chronic Fatigue Syndrome (CFS/ME)“
Unlike some conditions shown below, it is not just one bacteria involved but combinations.
Peptic ulcer disease: Helicobacter pylori
Tetanus: Clostridium tetani
Typhoid fever: Salmonella typhi
Diphtheria: Corynebacterium diphtheriae
Syphilis: Treponema pallidum
Cholera: Vibrio cholerae
Leprosy: Mycobacterium leprae
Tuberculosis: Mycobacterium tuberculosis
Sinusitis: Corynebacterium tuberculostearicum
Ombre Data
We have 10 bacteria that are too low and some 67 that are too high. Six of the 10 that are too low should be available as probiotics (conceptually), but only B.Bifidum is.
Bifidobacterium asteroides
Bifidobacterium bifidum
Bifidobacterium bombi
Bifidobacterium commune
Bifidobacterium magnum
Bifidobacterium thermacidophilum
In the too high group are some familiar names: Rickettsia (Cecile Jadin’s protocol) and spotted fever group.
Bacteria Name
Rank
Expected
Observed
Shift
Prob
Anaerococcus murdochii
species
22.1
40
Too High
0.000134
Anaerococcus octavius
species
23.2
36
Too High
0.00785
Anaerococcus senegalensis
species
21.6
34
Too High
0.007766
Bacteroides fluxus
species
82.2
111
Too High
0.001504
Bacteroides thetaiotaomicron
species
95.6
122
Too High
0.006947
Bifidobacterium asteroides
species
50.3
28
Too Low
0.004406
Bifidobacterium bifidum
species
76.3
49
Too Low
0.002295
Bifidobacterium bombi
species
80.8
44
Too Low
0.000136
Bifidobacterium commune
species
56.8
30
Too Low
0.000581
Bifidobacterium magnum
species
73.0
46
Too Low
0.002755
Bifidobacterium thermacidophilum
species
53.8
31
Too Low
0.004352
Campylobacter
genus
54.0
74
Too High
0.006445
Campylobacter hominis
species
26.8
43
Too High
0.001707
Campylobacteraceae
family
54.8
76
Too High
0.004245
Campylobacterales
order
61.6
83
Too High
0.006328
Desulfarculaceae
family
24.9
40
Too High
0.002442
Desulfarculales
order
24.9
40
Too High
0.002442
Desulfarculia
class
26.2
40
Too High
0.00692
Desulfocarbo
genus
14.8
26
Too High
0.003442
Desulfocarbo indianensis
species
14.6
26
Too High
0.002722
Desulfoglaeba
genus
27.8
42
Too High
0.007259
Desulfoglaeba alkanexedens
species
27.4
42
Too High
0.005339
Desulfovibrio legallii
species
32.5
48
Too High
0.006443
Desulfovibrio piger
species
35.9
53
Too High
0.004287
Dialister pneumosintes
species
14.8
27
Too High
0.001445
Emticicia
genus
19.3
33
Too High
0.001758
Emticicia sediminis
species
8.4
21
Too High
1.52E-05
Enorma
genus
22.4
35
Too High
0.007472
Enorma massiliensis
species
22.4
35
Too High
0.007472
Enterorhabdus
genus
69.6
45
Too Low
0.004671
Epsilonproteobacteria
class
62.7
84
Too High
0.007016
Ezakiella
genus
44.7
63
Too High
0.006216
Flavobacteriaceae
family
75.1
98
Too High
0.008138
Halanaerobiales
order
78.4
54
Too Low
0.005779
Hallella
genus
34.4
60
Too High
1.30E-05
Hallella bergensis
species
17.5
39
Too High
2.77E-07
Hallella multisaccharivorax
species
26.2
45
Too High
0.000235
Holdemania massiliensis
species
55.2
75
Too High
0.00788
Hoylesella buccalis
species
75.1
105
Too High
0.000552
Hoylesella loescheii
species
34.3
51
Too High
0.004268
Hoylesella marshii
species
15.6
30
Too High
0.000268
Hoylesella nanceiensis
species
30.4
48
Too High
0.001467
Humidesulfovibrio
genus
29.9
49
Too High
0.000497
Humidesulfovibrio idahonensis
species
27.8
47
Too High
0.000281
Hungateiclostridiaceae
family
78.0
106
Too High
0.001492
Insolitispirillum
genus
31.0
46
Too High
0.007226
Insolitispirillum peregrinum
species
30.4
46
Too High
0.004822
Leptolinea
genus
14.4
26
Too High
0.002277
Leptolinea tardivitalis
species
13.5
24
Too High
0.004247
Parabacteroides johnsonii
species
51.0
70
Too High
0.007925
Paraprevotella xylaniphila
species
25.0
42
Too High
0.000677
Parvimonas
genus
29.7
52
Too High
4.33E-05
Parvimonas micra
species
29.7
52
Too High
4.33E-05
Pedobacter
genus
36.3
53
Too High
0.005472
Peptoniphilus lacrimalis
species
34.6
51
Too High
0.005246
Persicobacteraceae
family
12.1
24
Too High
0.000587
Phocaeicola salanitronis
species
105.9
136
Too High
0.003396
Porphyromonas asaccharolytica
species
33.8
51
Too High
0.003157
Porphyromonas endodontalis
species
25.7
40
Too High
0.004944
Prevotella dentasini
species
6.8
29
Too High
1.25E-17
Prevotella denticola
species
4.2
27
Too High
1.35E-28
Prolixibacteraceae
family
20.7
33
Too High
0.006663
Propioniferax
genus
23.2
42
Too High
9.45E-05
Propioniferax innocua
species
22.8
42
Too High
5.61E-05
Rickettsia
genus
21.0
36
Too High
0.001101
Rickettsia honei
species
14.8
28
Too High
0.000569
Segatella bryantii
species
24.5
39
Too High
0.003287
Segatella maculosa
species
33.2
55
Too High
0.000161
Segatella oris
species
22.2
38
Too High
0.000807
Segatella paludivivens
species
32.9
54
Too High
0.000245
Senegalimassilia anaerobia
species
54.0
34
Too Low
0.006868
Slackia piriformis
species
56.5
29
Too Low
0.00048
spotted fever group
species group
17.9
32
Too High
0.000907
Tindallia
genus
14.8
26
Too High
0.003442
unclassified Burkholderiales
family
20.9
33
Too High
0.008034
unclassified Clostridiales
family
77.1
106
Too High
0.000984
Using Ombre Data
Biomesight Data
We have more data from Biomesight which means better (more) detection of significant bacteria.
As above, we have 12 bacteria that are too low and 116 bacteria that are too high. We have only 2 Bifidobacterium identified with only one available as a probiotic
Bifidobacterium adolescentis
Bifidobacterium cuniculi
We see that Lactobacillus is too high. This agrees with brain fog being caused by over production of d-lactic acid.
Lactobacillus acidophilus
Lactobacillus iners
We also see these two are high that are commonly associated to issues:
While the company no longer exists, we have a significant number of samples from them.
As above, we have Lactobacillus crispatus being too high. We have just 2 bacteria being too low and 96 being too high.
Tax_Name
Tax_Rank
Expected
Observed
Shift
Probability
Acetitomaculum
genus
24.4
44
Too High
7.07E-05
Acholeplasmatales
order
10.0
21
Too High
0.000503
Actinomyces sp. 2002-2301122
species
14.4
25
Too High
0.00497
Aggregatibacter
genus
42.2
24
Too Low
0.005171
Alistipes indistinctus
species
62.8
90
Too High
0.000602
Alistipes sp. NML05A004
species
81.8
111
Too High
0.001227
Alistipes sp. RMA 9912
species
13.7
25
Too High
0.002304
Anaerococcus murdochii
species
30.5
56
Too High
3.93E-06
Anaeroplasmataceae
family
22.8
38
Too High
0.00148
Anaeroplasmatales
order
23.1
39
Too High
0.000914
Archaea
superkingdom
39.7
73
Too High
1.32E-07
Atopobium
genus
17.8
30
Too High
0.00374
Bacteroides eggerthii
species
30.5
52
Too High
9.98E-05
Bacteroides sp. 35AE37
species
66.0
92
Too High
0.00139
Bacteroides sp. XB12B
species
39.7
66
Too High
3.10E-05
Blautia stercoris
species
37.2
55
Too High
0.003458
Butyricimonas
genus
88.4
114
Too High
0.006407
Butyricimonas faecihominis
species
57.7
79
Too High
0.005005
Butyricimonas sp. 214-4
species
53.8
75
Too High
0.003921
Butyricimonas virosa
species
42.3
62
Too High
0.002455
Caldicoprobacter
genus
23.9
39
Too High
0.001957
Caldicoprobacteraceae
family
44.2
68
Too High
0.00034
Campylobacter hominis
species
27.9
42
Too High
0.007781
Campylobacter ureolyticus
species
24.4
41
Too High
0.000762
Catenibacterium
genus
57.9
80
Too High
0.003678
Christensenella minuta
species
23.1
36
Too High
0.007121
Cloacibacillus
genus
19.8
38
Too High
4.36E-05
Cloacibacillus evryensis
species
14.7
31
Too High
2.24E-05
Coprobacter secundus
species
32.8
53
Too High
0.000426
Corynebacterium diphtheriae
species
11.5
21
Too High
0.005334
Corynebacterium sp. 713182/2012
species
16.2
27
Too High
0.006945
Desulfovibrio
genus
72.6
97
Too High
0.004103
Desulfovibrio sp. 3_1_syn3
species
9.0
30
Too High
2.23E-12
Dialister micraerophilus
species
9.6
24
Too High
3.85E-06
Dialister propionicifaciens
species
41.0
58
Too High
0.008017
Dialister sp. S7MSR5
species
16.8
29
Too High
0.002792
Eubacterium
genus
27.2
46
Too High
0.000305
Euryarchaeota
phylum
39.7
73
Too High
1.32E-07
Fibrobacter
genus
14.9
27
Too High
0.001656
Fibrobacteraceae
family
24.1
47
Too High
3.08E-06
Fibrobacterales
order
32.6
61
Too High
6.22E-07
Fibrobacteria
class
32.6
61
Too High
6.22E-07
Fibrobacterota
phylum
32.6
61
Too High
6.22E-07
Gelria
genus
37.6
65
Too High
7.75E-06
Granulicatella adiacens
species
69.5
45
Too Low
0.006077
Herbaspirillum
genus
46.7
72
Too High
0.000218
Herbaspirillum seropedicae
species
39.0
62
Too High
0.000225
Hespellia
genus
96.4
123
Too High
0.006732
Hoylesella timonensis
species
23.4
40
Too High
0.000577
Hungateiclostridiaceae
family
26.4
43
Too High
0.001246
Hydrogenoanaerobacterium
genus
40.6
64
Too High
0.000246
Lactobacillus crispatus
species
26.1
40
Too High
0.006759
Lentisphaeria
class
53.6
75
Too High
0.003432
Lentisphaerota
phylum
53.6
75
Too High
0.003432
Methanobacteria
class
37.4
73
Too High
6.10E-09
Methanobacteriaceae
family
37.4
73
Too High
6.10E-09
Methanobacteriales
order
37.4
73
Too High
6.10E-09
Methanobrevibacter
genus
36.9
71
Too High
2.03E-08
Methanobrevibacter smithii
species
36.4
66
Too High
9.34E-07
Methanomada group
clade
37.4
73
Too High
6.10E-09
Mollicutes
class
30.0
49
Too High
0.00052
Murdochiella
genus
42.2
65
Too High
0.000434
Mycoplasmatota
phylum
30.0
49
Too High
0.00052
Opitutia
class
16.4
33
Too High
4.20E-05
Oxalobacteraceae
family
47.7
73
Too High
0.000257
Parabacteroides johnsonii
species
18.8
34
Too High
0.000451
Parasporobacterium paucivorans
species
16.2
29
Too High
0.001388
Parvibacter
genus
14.1
33
Too High
4.82E-07
Parvibacter caecicola
species
12.3
29
Too High
1.95E-06
Peptococcus
genus
71.8
100
Too High
0.000867
Peptoniphilus lacrimalis
species
30.3
46
Too High
0.004193
Porphyromonas sp. 2024b
species
12.7
29
Too High
4.76E-06
Propionibacteriaceae
family
18.8
31
Too High
0.004859
Propionibacteriales
order
18.8
31
Too High
0.004859
Puniceicoccales
order
16.2
33
Too High
2.76E-05
Robinsoniella
genus
30.3
50
Too High
0.00033
Robinsoniella sp. KNHs210
species
22.6
37
Too High
0.002366
Staphylococcaceae
family
38.5
57
Too High
0.002786
Staphylococcus
genus
38.2
57
Too High
0.00235
Synergistaceae
family
41.8
72
Too High
2.96E-06
Synergistales
order
41.8
72
Too High
2.96E-06
Synergistia
class
41.8
72
Too High
2.96E-06
Synergistota
phylum
41.8
72
Too High
2.96E-06
Thermoanaerobacteraceae
family
37.7
65
Too High
8.62E-06
Thermoanaerobacterales
order
39.7
66
Too High
3.10E-05
unclassified Butyricimonas
no rank
53.1
77
Too High
0.001019
unclassified Desulfovibrio
no rank
12.6
43
Too High
8.86E-18
unclassified Finegoldia
no rank
31.8
47
Too High
0.006982
unclassified Phascolarctobacterium
no rank
11.5
23
Too High
0.000738
unclassified Porphyromonas
no rank
24.4
38
Too High
0.005801
unclassified Prevotella
no rank
9.6
21
Too High
0.000258
unclassified Robinsoniella
no rank
22.6
37
Too High
0.002366
unclassified Staphylococcus
no rank
26.4
43
Too High
0.001246
Varibaculum
genus
48.5
70
Too High
0.001966
Varibaculum sp. CCUG 45114
species
36.1
54
Too High
0.002986
Victivallaceae
family
53.6
75
Too High
0.003432
Victivallales
order
53.6
75
Too High
0.003432
Victivallis
genus
53.1
75
Too High
0.002607
Bottom Line
In terms of probiotics, there are two that should be considered:
Bif. Bifidum
Bif. Adolescentis
And all Lactobacillus probiotics avoided.
The above information will be eventually integrated into Microbiome Prescription suggestions expert system. The purpose is to first identify the bacteria of concern.
The following bacteria were reported by 2 or 3 of the above