
See also:
- The taxonomy nightmare — Episode II
- The taxonomy nightmare before Christmas… Episode III
- There is no normal nor reference microbiome! – Reference ranges ignore critical factors
- Microbiome Tests Obfuscation of the Microbiome With Video
This post is intended to educate people more on the technical aspects of the microbiome. I am not talking about taking 4 samples from one stool and sending it to 4 different testing company. I am talking about one sample sent to one testing company which then provided their analysis and a FASTQ file. The raw data.
What is a FASTQ file (besides being megabytes big)? It is the DNA (technically the RNA) of the bacteria in the stool. It looks like this (using the 4 letters that DNA has):
CCGGACTACACGGGTTTCTAATCCTGTTTGATACCCACTCTTTCGAGCATCAGTGTCAGTTGCAGTCCAGTGAGCAGCCTTCGCAATCGGAGTTCATCGTTATATCTAAGCATTTCACCGCTACACAACGAATTCCGCACACCTCTA
The file that I am using as text would be around 16 megabytes. This data comes from a lab machine. The company then processes it through their software to match up sequences to bacteria.
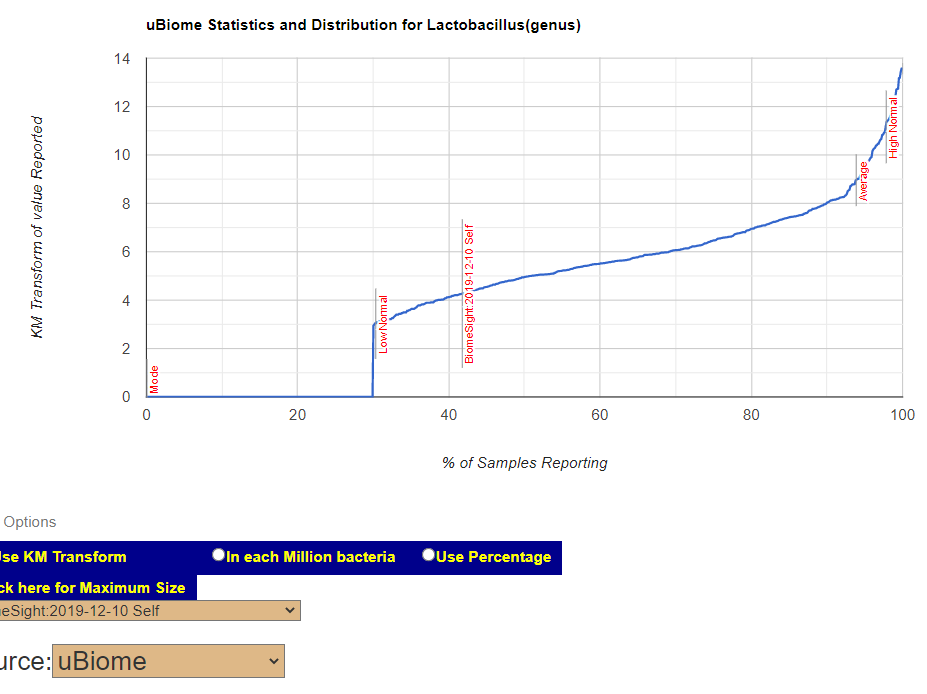
In this post, I am using the FASTQ from uBiome and getting reports on the bacteria from:
- ubiome
- thryve inside
- biomesight
- sequentia biotech.
Naively, one would expect almost identical results. What I got is shown in detail below. At a high level we had the following taxa counts reported
- ubiome – 253
- thryve inside – 632
- biomesight – 558
- sequentia biotech 366
I did a more technical post on my other blog. From some providers, a taxonomy may be 40% on another 2% or even none… ugly!
Here, we compare the performance of 14 differential abundance testing methods on 38 16S rRNA gene datasets with two sample groups. We test for differences in amplicon sequence variants and operational taxonomic units (ASVs) between these groups. Our findings confirm that these tools identified drastically different numbers and sets of significant ASVs, and that results depend on data pre-processing.
Microbiome differential abundance methods produce different results across 38 datasets [2022]
New 2026 Study in Nature
A visual demonstation using 2 16s tests and a shotgun test
The headaches!
Number One Issue: You cannot, repeat cannot, compare a taxonomy report from one lab with another. EVER!
- I have 8 uBiome reports and 2 Thryve reports. I can compare the uBiome to each other and the Thryve to each other. I can never mix their direct taxonomy reports !
Number Two Issue: If I wish to compare different lab reports, I MUST obtain the FastQ files from each lab and process them thru the same provider. The FastQ files are the raw data! For me, I prefer to push them through multiple providers which means that the 10 reports suddenly become 40 or 50 different reports in my site.
- This means a lot more work for the typical user. It also means that guidance, like that from Jason Hawrelak Criteria for Healthy Gut, would need to be revised to be provider specific!
For more details with examples, see The problem with “official” ranges from labs
Examples
Only one lab reports Ehrlichia ovina….. why?? The values for other bacteria are all over the place from different labs


My Headaches
I have revised my site to show data by specific provider (while keeping the across all provider data still available). A lot of pages to revise and test.

A video walking through issues:
https://www.youtube.com/watch?v=iN7dbtFsOXE
Some additional readings:
- Navigating microbiome variability: implications for research, diagnostics, and direct-to-consumer testing [2025]
- The standardisation of the approach to metagenomic human gut analysis: from sample collection to microbiome profiling [2022]
- Standardization of laboratory practices for the study of the human gut microbiome [2022]
