Using multiple Ubiome results to monitor progress

There is a comparison tool at http://microbiomeprescription.com/ which allows you to view change in three different ways:

  • Change in number of matches to known illness profiles
  • Change in End Products product
  • Counts of Bacteria.

How to do it

On the landing page after logging in you will see this at the top. Click it.

compare2

You will then be presented with available samples

sample-1

Select at least two. then click one or another of the three buttons.

Summary — Compare to Profiles

In general, you want your numbers to go DOWN, especially if you have a listed condition

sample3

EndProducts – Metabolites produced by the bacteria

sample8

Details – by Bacteria, Symptoms, Metabolism

There are three reports here — two may be empty if you did not enter information. The last one is always there: Bacteria Change

sample9

Bottom Line

The two easiest to interpret on the first ones:

  • How many shifts are matches with known shift in different illnesses
  • Are you moving closer to the end products seen in healthy people


FDA Alert on some Contaminated Prescript Assist batches

From: https://www.fda.gov/safety/recalls/ucm612266.htm

fda

Suggestions based on Symptoms Alone

The strong associations found with the End Products resulted in a reader asking “Can’t you create a page of recommendations based on symptoms alone?”

This took me back a little – what!!!  Then I realized that it was possible.  The process is simple:

  • From the symptoms, determine the End Products with a rough t-score of 3 or more
    • THIS IS BASED ON CONTRIBUTED UBIOMES with SYMPTOMS
  • Get all of the bacterias associated with those End Products
  • Assume that the t-score is a proxy on how short or high that these bacteria are
  • Send this collection of bacteria and shifts off to the recommendation engine…

Voila you have suggestions!  What they are worth is another question — the End Product is still a beta concept, this page would be pre-beta, i.e. an alpha concept.

With the above disclaimers, let us go to show how you can play around with it.

Pick your symptoms

I would suggest working from most frustrating to least frustrating. Add them one at a time.

Go to  http://microbiomeprescription.com/Data/SymptomEndProductExplorer 

I picked

sample4

A new page opened

sample5

I add another symptom

sample6

and Repeat

sample7

Bottom Line

This was an interesting challenge — it has logic and science behind. It does not have any clinical experience yet.  I suspect that I will keep adding data… and more important, users will keeping adding ubiome WITH SYMPTOMS.

The above depends on those ubiomes with symptoms. 

BIG DISCLAIMER

This is an education post to facilitate discussing this approach with your medical professionals. It is not medical advice for the treatment of any medical condition. Always consult with your medical professional before doing any  changes of diet, supplements or activity. Some items cites may interfere with prescription medicines.


End Product Predictions vs New CFS Study

A reader sent me a link to a new study, July 3rd, 2018 “Insights into myalgic encephalomyelitis/chronic fatigue syndrome phenotypes through comprehensive metabolomics“. Authors include some well known CFS researchers: Nagy-Szakal D1Barupal DK2Lee B1Che X1Williams BL1Kahn EJR1Ukaigwe JE1Bateman L3Klimas NG4,5Komaroff AL6Levine S7Montoya JG8Peterson DL9Levin B10Hornig M1Fiehn O11Lipkin WI12.

Full text is here. WARNING: Heavy data science language used.

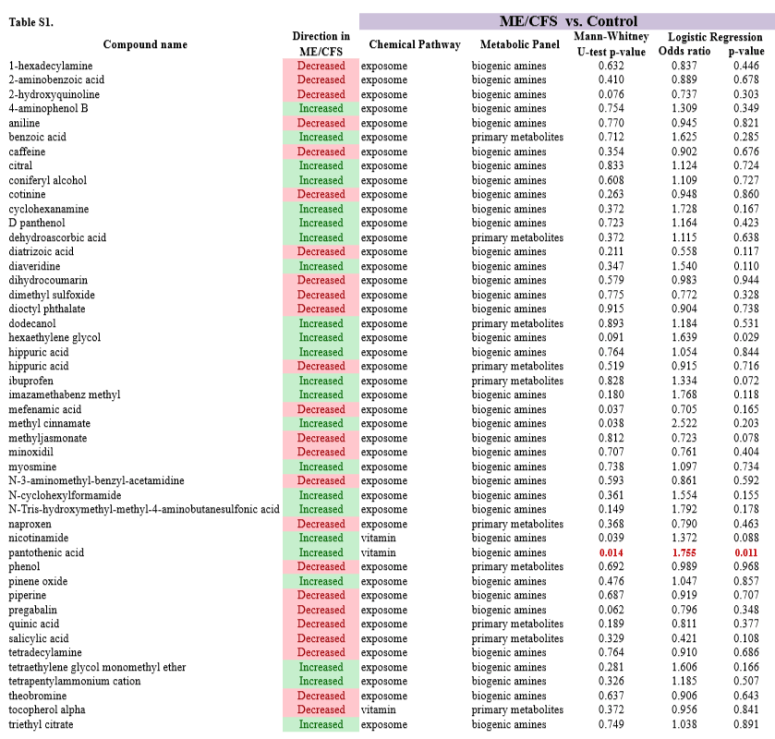
In the supplemental material was a table of compound names and shifts in CFS patients:

Study2

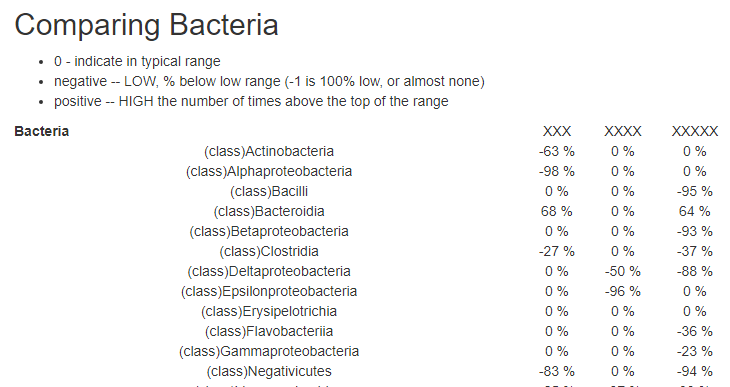
I was curious to see how that compared to predictions from the ubiomes of people with a CFS diagnosis. That table is at http://microbiomeprescription.com/Data/SymptomEndProductExplorer?site=gut&filter=266.

The only items on both lists were:

  • pantothenic acid — both were high
  • Nicotinamide versus niacin were opposite. They are different forms of the same chemical group

Their studies excluded looking at most B vitamins (which raise question on why some B vitamins were included – patients may be taking B-100 supplements).

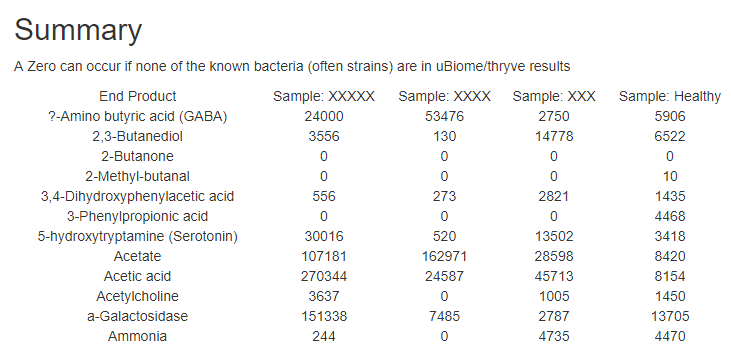
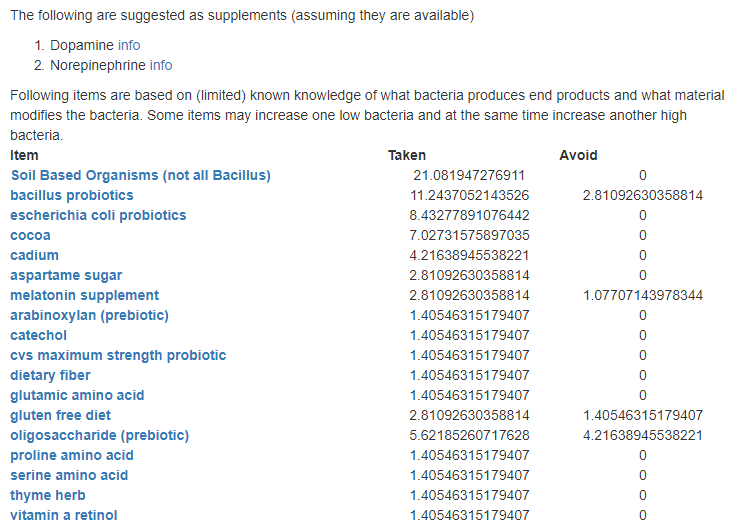
In terms of B vitamins, the end products predicted from the ubiome results for CFS diagnosis are:

  • LOW Norepinephrine Info 37.79 for significance
    • ” CFS patients had significantly higher levels of plasma norepinephrine” [2016]
  • LOW Dopamine Info 34.41  for significance
    • “Pro-inflammatory cytokines can alter the metabolism of serotonin (5-HT) and dopamine (Felger and Miller, 2012),* effecting dysregulation of associated neurotransmitters, including glutamate, norepinephrine (NE, noradrenalin), and corticosteroids. 5-HT and NE are the major neurotransmitters ” [2017]
  • LOW Tyrosine Info 29.33 for significance
    • ” levels of tyrosine, the rate-limiting dopaminergic precursor, were significantly lower at all time points in the CFS patients.” [2003]
  • LOW Niacin (Vitamin B3) Info  12.41 for significance
  • LOW Succinate Info 5.59 for significance
  • LOW Thiamine (Vitamin B1) Info 4.17 for significance
  • HIGH Folate (Vitamin B9) Info  3.02 for significance
  • LOW Phenylacetic acid Info 2.32
  • HIGH Biotin (Vitamin B7) Info 2.99
  • HIGH Riboflavin (Vitamin B2) Info 2.26
  • LOW Pantothenate (Vitamin B5) Info 2.22
  • LOW Isovaleric acid Info 2.19
  • LOW Cobalamin (Vitamin B12) Info 1.93

Some of these agree with studies and some do not appear to. We need to remember some complicating factors:

  • We are looking at production in the gut, other things may have a hearty appetite there and the production may not make it to the circulating blood.
  • There is the rationing hypothesis — if the body is low in a metabolite, signal are sent out to shut down other consumers, and only essential functions consume it.

Depression

In an earlier post, “Additionally, Isovaleric acid in stool correlates with human depression.[2016] hence isovaleric acid producing bacteria appear to be another facet.”

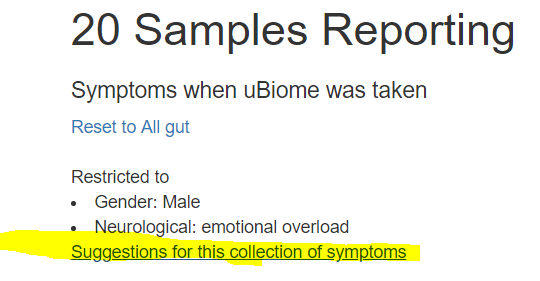
Looking at those that report depression, http://microbiomeprescription.com/Data/SymptomEndProductExplorer?site=gut&filter=,287

we found isovaleric acid (LOW), dopamine (LOW) etc. with similar to the above. The problem is that we have depression associated with CFS and true depression mixed in our data.

Bottom Line

This beta-forecast of end-products is interesting because of the number of strong associations found. In many cases, they agree with common accepted knowledge — in most other cases, we find the end product is significant according to the literature but the predicted shift is opposite to what is reported in the literature.

As a data scientist, getting the association is key. The sign of the association is less significant and ceases being an issue if random forest or tensor flow is applied to the data.


End Product Explorer is up

I have the three symptom explorers under the same item on the menu now. There is no need to login to use them. Site: http://microbiomeprescription.com/

explorer

All of these follow the same pattern — select a symptom and the data at the bottom of the page is updated to report on the subset with this symptom.

For example,  I clicked on:

And see this result:

Throat

Looking only at values over 2.0 we see:

  • Very low biogenic amines bacteria
  • High Co-enzyme A bacteria
  • High Acetate bacteria
  • High Folate bacteria
  • High Formic acid bacteria
  • High Panthothenate  bacteria
  • High Riboflavin bacteria.

I must admit — this was a surprise!

Changing to

We have:

  • Extremely low Polyhydroxyalkanoic acids bacteria
  • Low Norepinephrine bacteria
  • Low Formic acid bacteria
  • High Folate acid bacteria

Changing to

We have

  • Low Dopamine bacteria
  • High Folate bacteria
  • Low Norepinephrine bacteria
  • Extremely low Polyhydroxyalkanoic acids bacteria
  • etc

I will leave people to explore their own symptoms.