Over this weekend I deprecated my earlier comparison tool and replaced it with more comparisons. To use this tool you need at least three samples uploaded. The comparisons available ate:
By Bacteria
By End Products
By Enzyme production
By KEGG Module
Purpose or Usage
The intent is to address the following two needs (there may be more)
You want to see what has changed from your prior samples. Typically, to see improvement or deterioration.
You have an individual with challenges and have other samples from your microbiome bubble.
People with shared DNA are part of your bubble
People eating the same diet (i.e. family meals) are part of your bubble
Conceptually, people with the share medical conditions could by part of the bubble. My observations is that these people should have the same symptoms not just the same diagnosis.
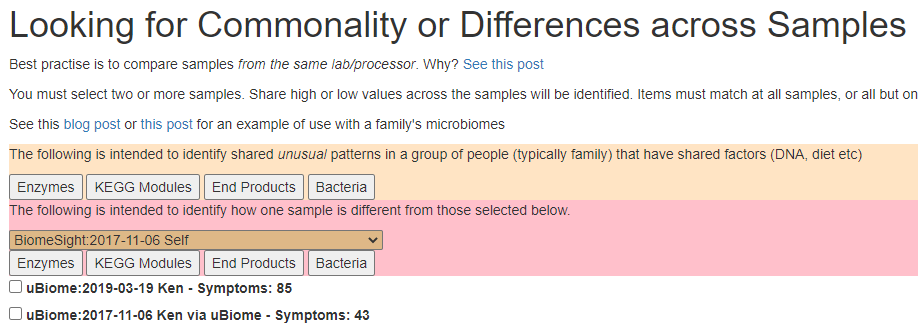
There are four methods of comparison of one specific sample against a collection of reference samples.
Values outside of the values of the reference sample
Values outside of the values of the reference sample increased by one standard deviation up and down
Values outside of the values of the reference sample increased by two standard deviations up and down
Values outside of the values of the reference sample that are also in the extreme compared to other samples uploaded (top or bottom 3-6%)
Select the reference below the buttons, pick up the one to compare to above and then click one of the buttons
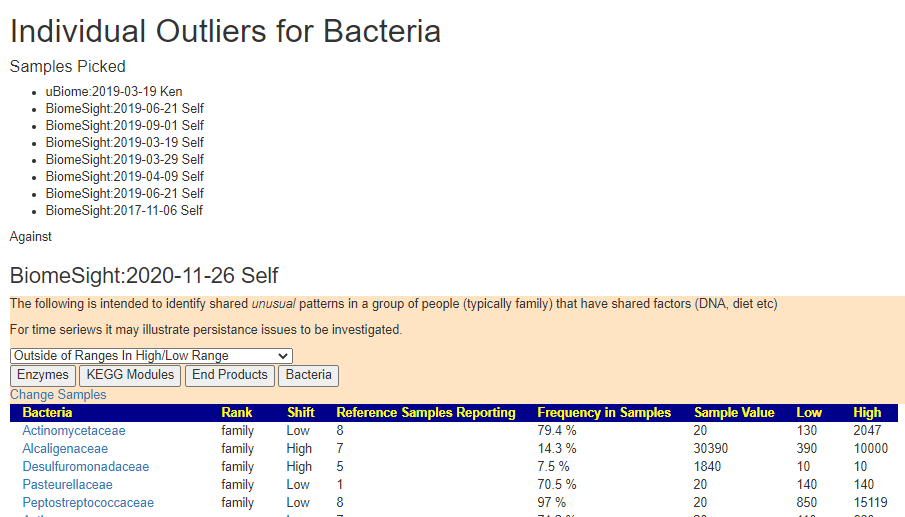
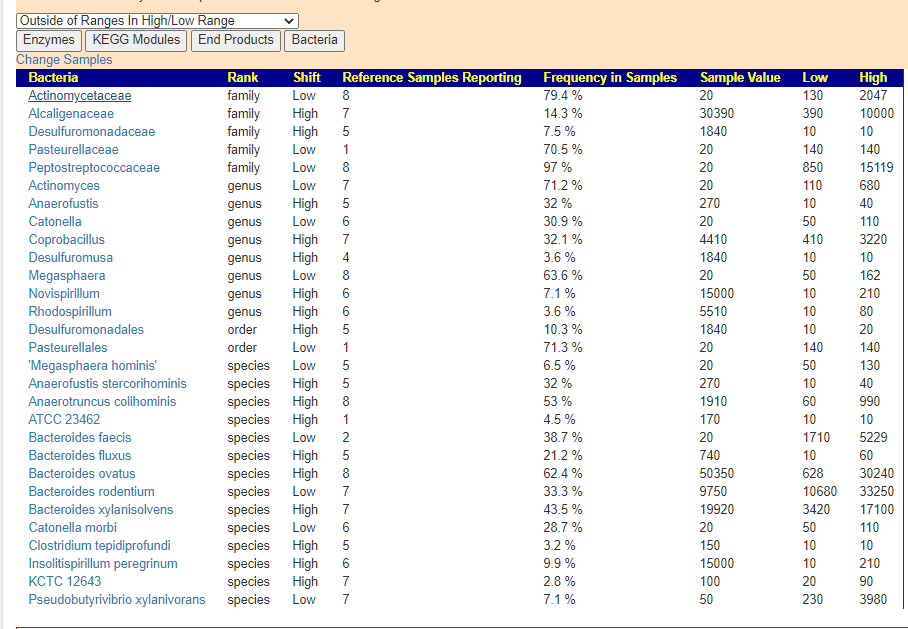
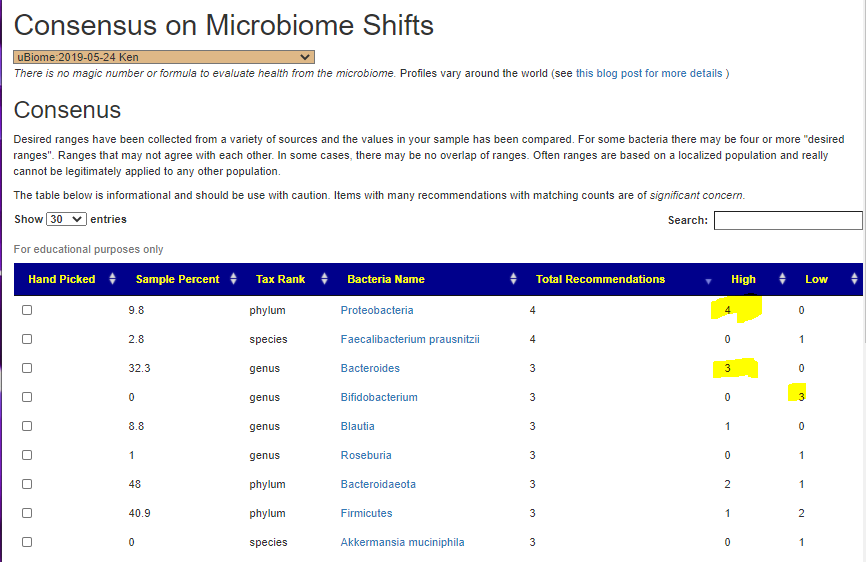
Bacteria
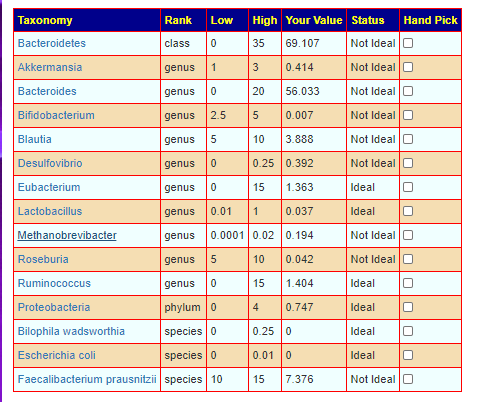
I picked several prior samples and my latest sample for comparison. Note that Reference Samples Reporting if less than all (in this case 8), it means that there were some zero values (and thus, you may wish to ignore shifts being low for those).
I tried different method and was surprise to see a long list of bacteria that have readings very different than than prior samples and also extreme values.
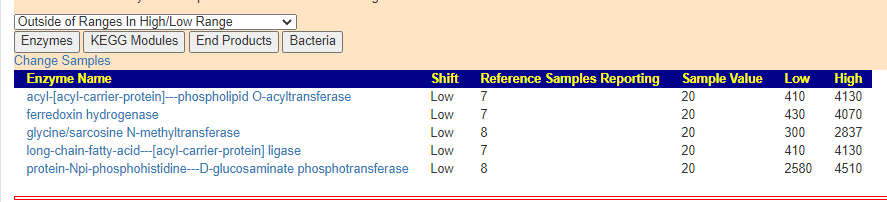
Note: The high and low thresholds are listed and your current values. You may need to use judgement if something is a significant change.
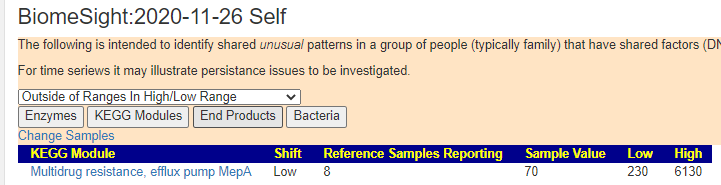
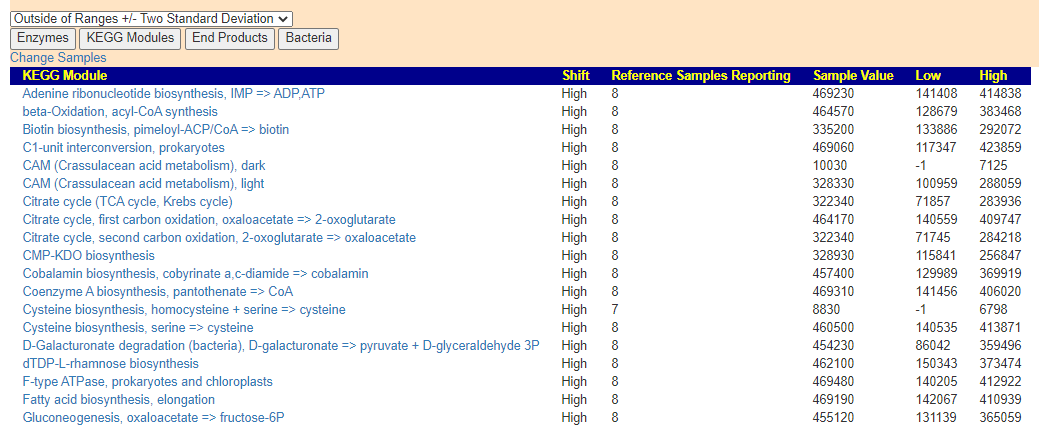
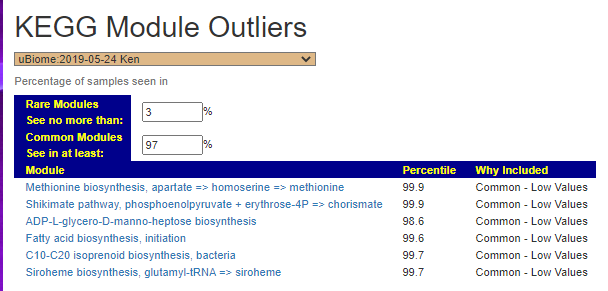
KEGG MODULES
When I want to see just what shifted without restricting to high/low values also, we get a much bigger list.
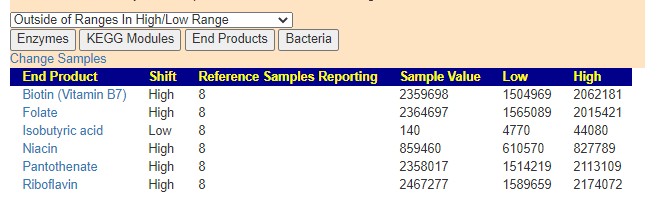
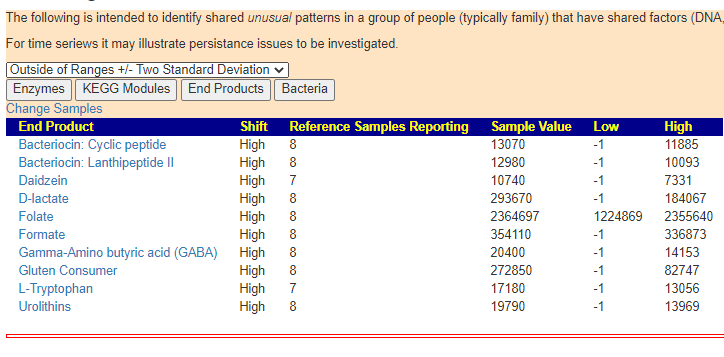
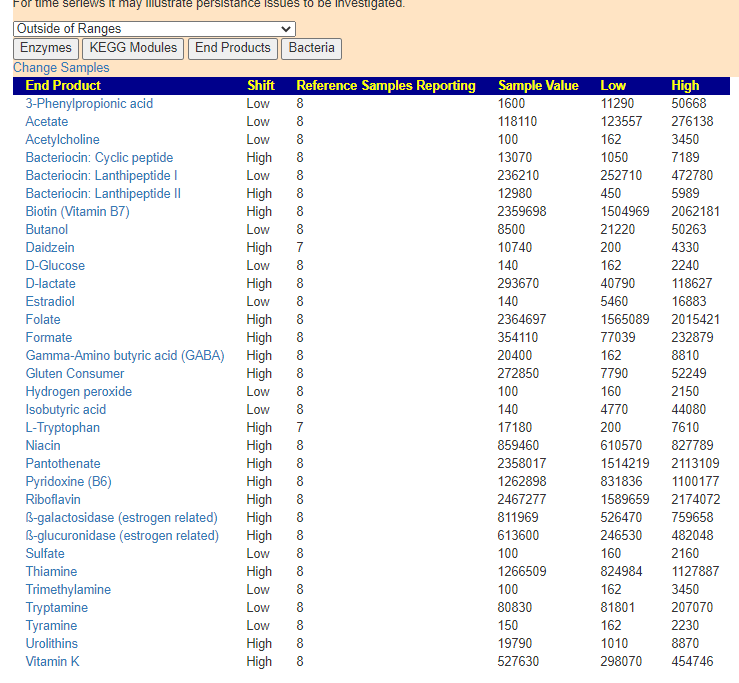
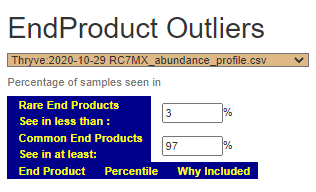
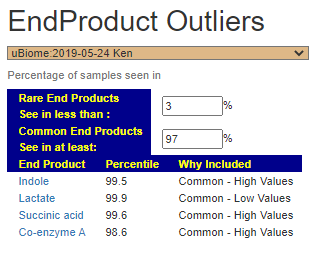
End Products
Changes that also pushed values into top and bottom of rangesThings that significantly changedItems with some changes
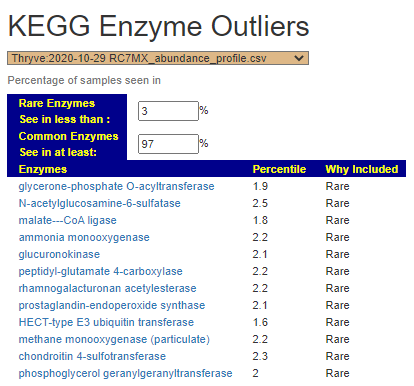
Enzymes
Change with values going to extremes
When I look at changes in general, the list became massive…
Bottom Line
This tool gives information on what changed… what it means and what to do with it is a different question. At the moment, I would suggest reading and researching items that seems to be major. The microbiomeprescription.com site gives suggestions on modifying bacteria numbers.
This is an analysis of a parent with two children with a mixture of challenges. A person’s microbiome and their DNA appears to be related. Ignoring studies, it makes logical sense. The DNA favors certain metabolites, which favors certain bacteria — and the reverse.
Perturbations in the gut microbiota have been linked to atopic diseases. However, the development of atopic diseases depends not only on environmental factors (like microbial stimulation) but also on genetic factors.
P – Parent: No ASD, nor CFS. No current IBS (I had IBS symptoms 2003-2012). Sample: BiomeSight
A : ASD/CFS Sample: Thryve, FASTQ processed thru BiomeSight
B : No IBS. He had SIBO in 2017. Has been in remission from PANS for about 1 year prior to sample. Sample: BiomeSight
They live in the same household with similar meals.
Looking for Family Shifts
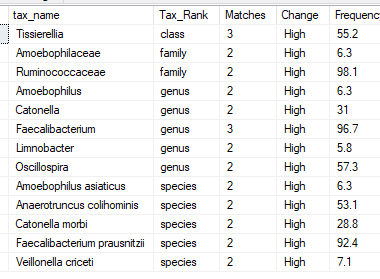
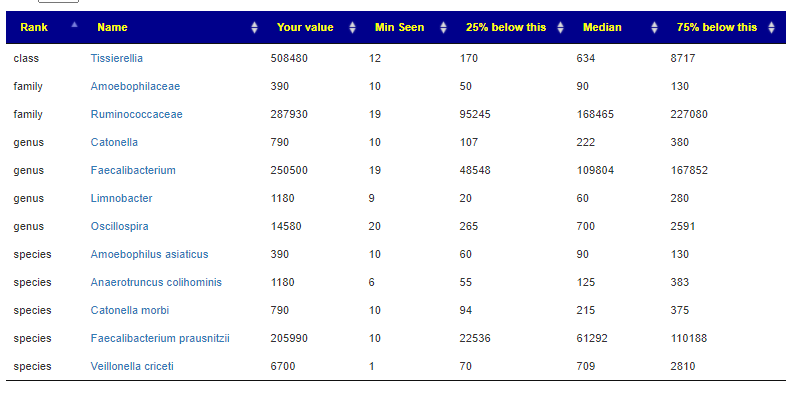
I looked first for bacteria that were high (top 6%) or low (bottom 6%) across multiple samples and found some interesting patterns:
Items like Limnobacter and Amoebophilus really jumps out. They are rare, so the odds of 2 people at random having them and both being in the top 6% is about 0.002%. Adjusting for BiomeSight samples only, the odds decrease but still less than 1%.
The unfortunate aspect is that of these 4 bacteria, we only have significant data on how to reduce Faecalibacterium. Checking PubMed on Limbobacterm, we see barely 40 studies with the count being low in Parkinson’s disease [2018]
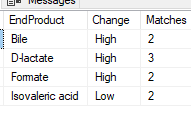
End Products Shift Shared
Applying the same criteria for End Products being produced, we have d-lactate being #1. This is common with CFS and I have written about it before (see posts below). It is also likely common with ASD.
For which bacteria produces which end products, see this page. I have on my backlog of features a page that makes suggestions based on end products to be shifted only. At the moment, it’s a manual process of hand picking bacteria.
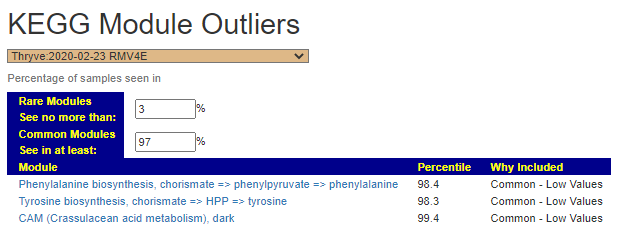
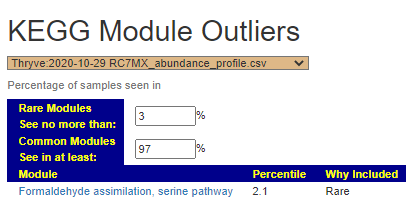
KEGG Module
Here, we will use top and bottom 3% since we have a lot more categories to examine. We found no shared items.
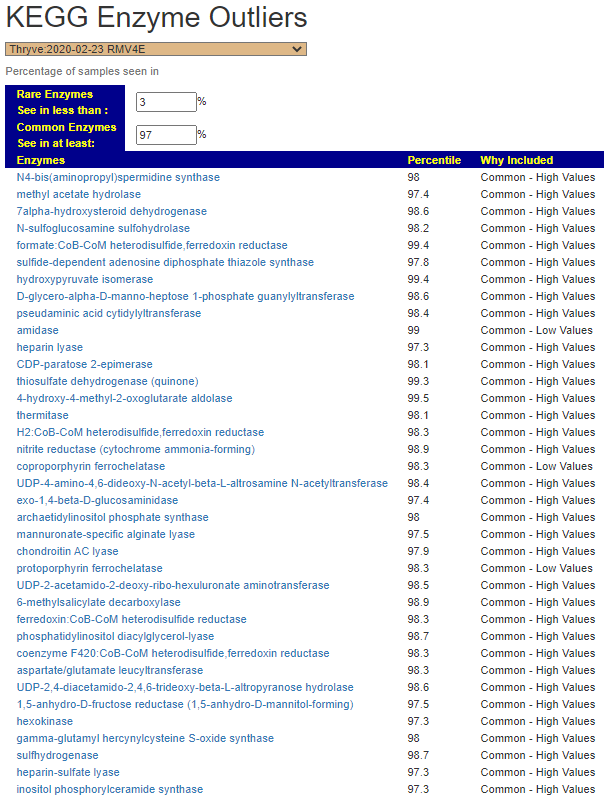
KEGG Enzymes
Here, we had only one hit.
Bottom Line
The intent of this post was to look at commonality over a genetic related group of people living in the same house and likely eating the same diet.
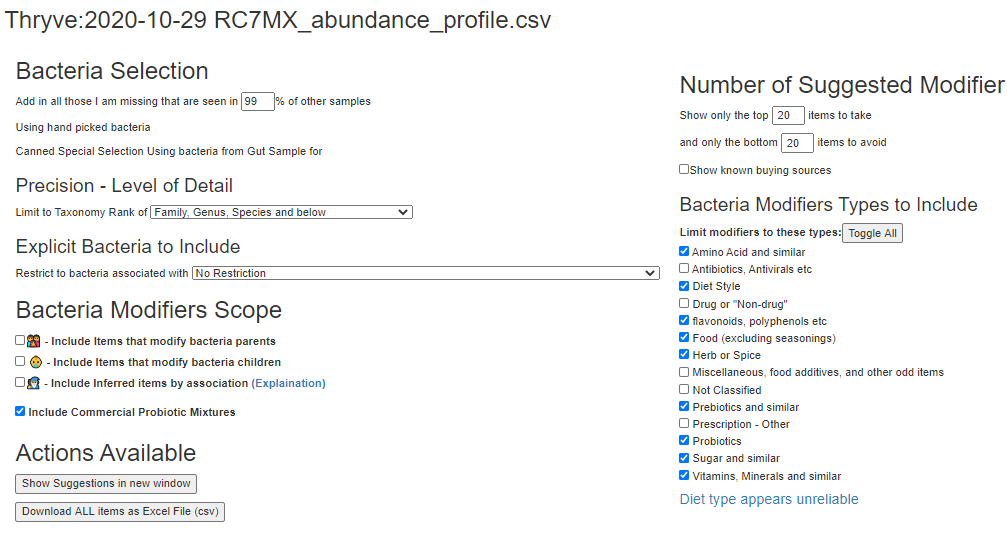
For individual suggestions by person, I would advocate doing a hand picked taxonomy and working from there. For the child with ASD/CFS, I went and did that with their sample
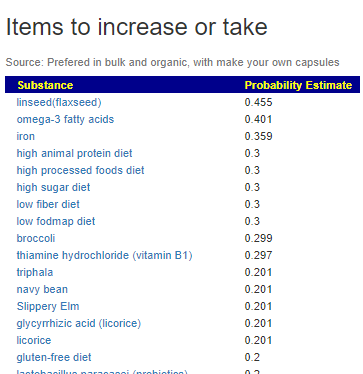
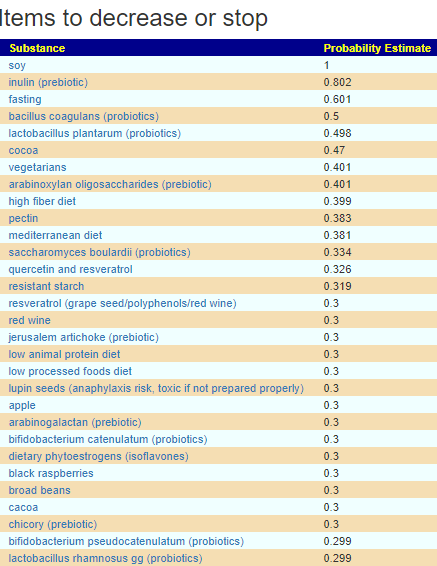
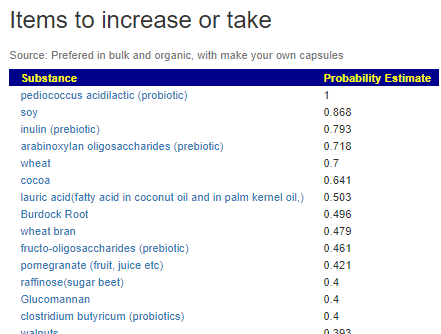
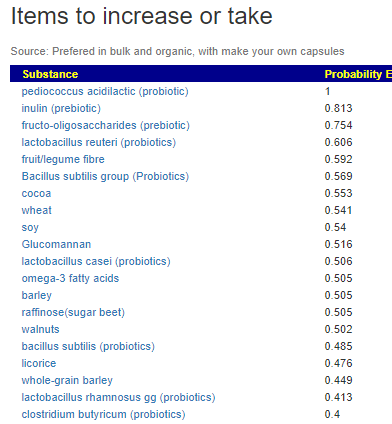
The resulting suggestions are shown below:
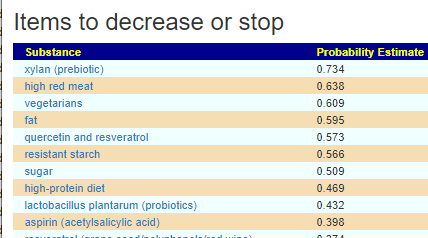
Items to take are low in values, thus items to avoid is of greater importanceMany of the above would be “internet myth” as being good to take blindly.
As always, these are suggestions that should be reviewed with your medical professional before doing. They are items believed to have better odds of making favorable changes than picking random items to try.
Future Pages
Most of the analysis above was done via ‘the backdoor’ and not available yet on the web site. The analysis code is written, it’s just a matter of getting time to create and test the pages.
The suggestions are below. Many of which I am already doing.
All items to avoid was down at 0.261 or less, so I excluded them
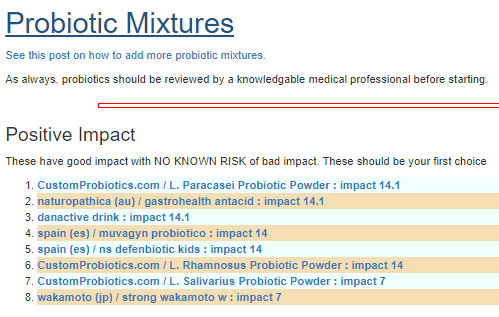
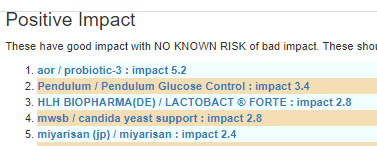
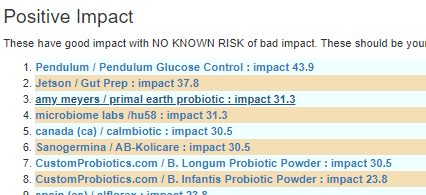
The high priority probiotics are below
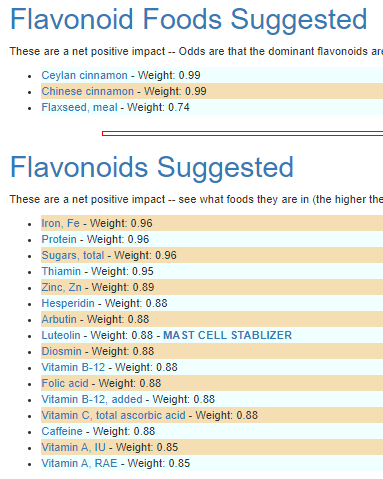
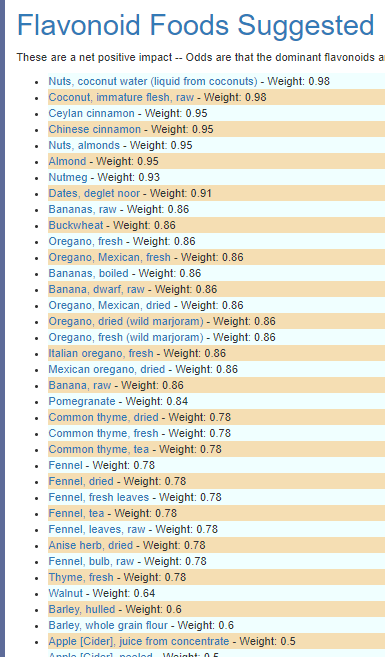
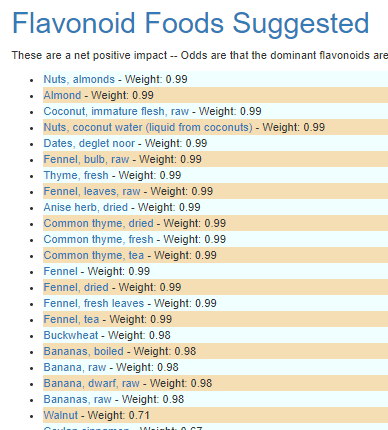
Based on foods containing desired flavonoids
Targeted Suggestions
Target suggestions means hand picking the bacteria and then getting the suggestions based on that specific subset.
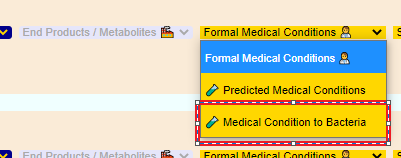
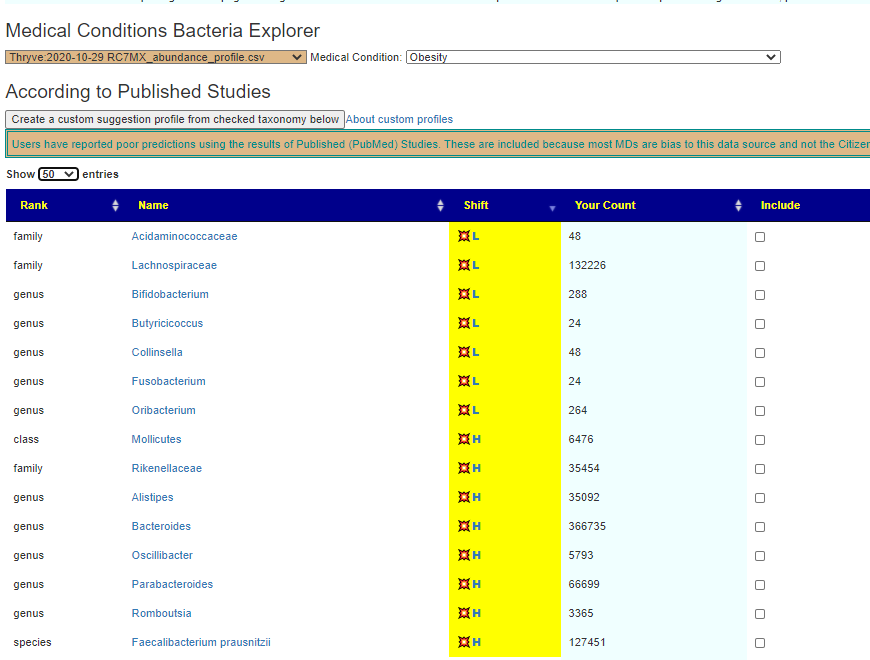
Obesity – Medical Literature
Where you find this
This is easy to do, just go to the page and check (under include) the items and then click [Create a custom suggestion profile…] button
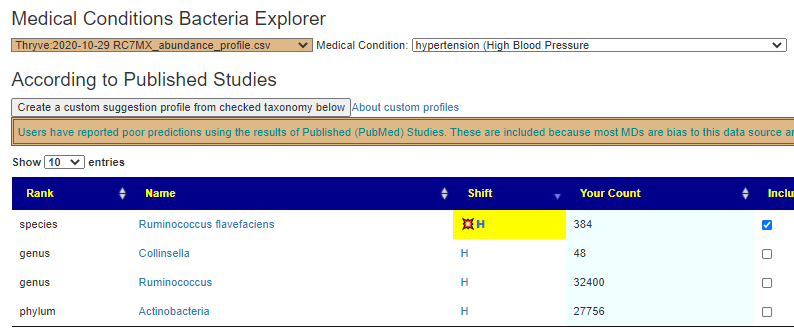
I now do the same for high blood pressure. I am not surprised to see only one item because I have been using supplements shown to reduce blood pressure for a few months (see Hypertension – What we know)
Last item was Bifidobacterium … I do not need to do anything because it is included in the lists above.
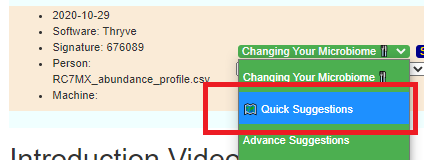
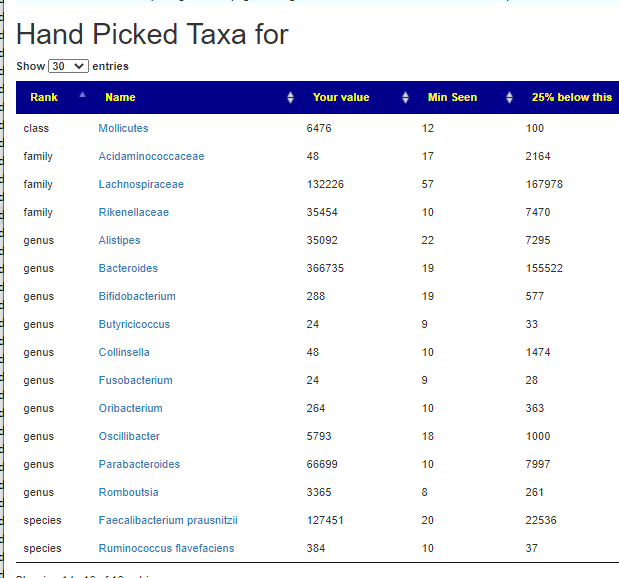
Getting Custom Suggestions
Once you have hand picked items, a new drop down appears as shown below.
You can review what is in the hand picked suggestions, your values and the values seen from others.
With Quick suggestions, the items below were pre-selected. You can modify them as you wish
Hand Picked Suggestions
The suggestions are generally similar but a few new items appear and the weight of some items have moved up or down.
What is different is that some items were above 0.4 in the avoid list:
Some of these items I am/was taking
The list of probiotics changed significantly
Notice the addition of specific Bifidobacterium probiotics
Flavonoid Foods are similar but cinnamon, nutmeg, and oregano are gone.
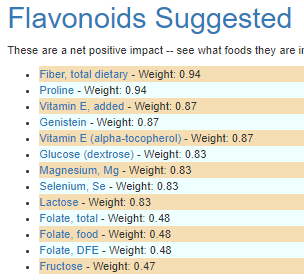
The list of Flavonoids is much larger and contain several supplements.
Bottom Line
I will be working off the handpicked taxa suggestions because they are more likely to be effective for my three goals.
The more focused (the fewer the goals, the better the suggestions should be because there is less noise).
Barley porridge with soy or almond milk and walnuts will likely be my standard breakfast for a few months. I have ordered B. Longum and B. Infantis from CustomProbiotics which is by far the cheapest BCFU per $, but IMHO also superior because it is pure with no additives or other species. For other sources see this post – remember to cost out BCFU per $, you may get some wallet shocks!
I admit it, I do not like many of the simplifications that I see for determining gut health. Those approaches were often the best available a decade ago; taught at universities, etc — but the world of the microbiome has moved at warp speed since. This is the 2nd part of my latest microbiome results, done with reference to a ME/CFS flare in 2019. The first part was Microbiome Outliers which showcased new analysis tools.
For many people with ME/CFS, simplifications will often be the limit of their cognitive ability due to brain fog. So…. I support the popular simplifications on my site so there is at least some data that they can grasp.
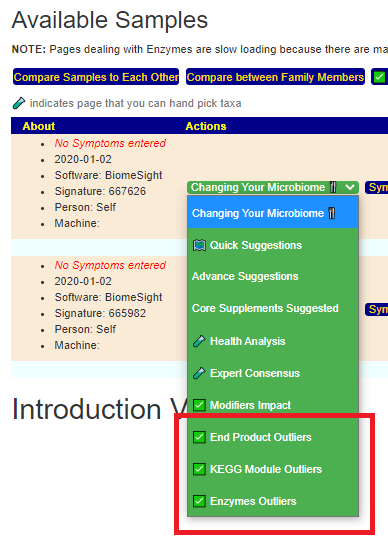
This post looks at the items below.
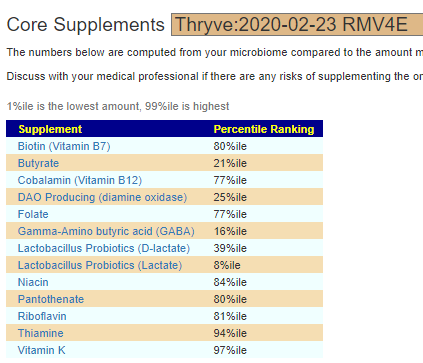
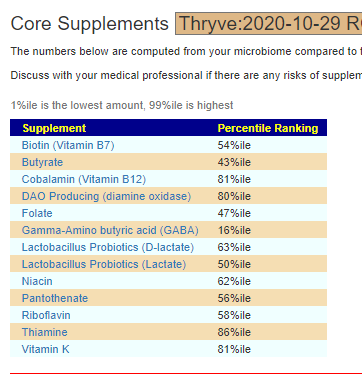
Core Supplements Suggested
Nothing was in the top or bottom 5%. Lactate Probiotics was the worst, with GABA lowLactate producing probiotics have normalized, DAO (histamine/allergies handling) has improved/ GABA still low.
The conclusion is that GABA supplementation may have a little effect, but a major difference is not expected.
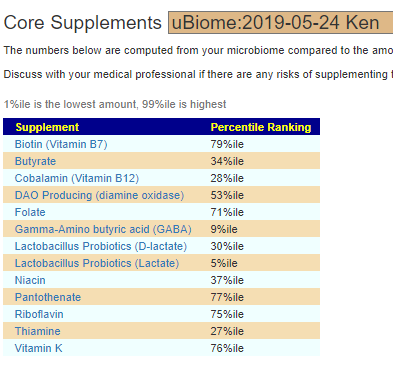
For reference, my levels with active ME/CFS is below. GABA and Lactate were much lower then (and other things off).
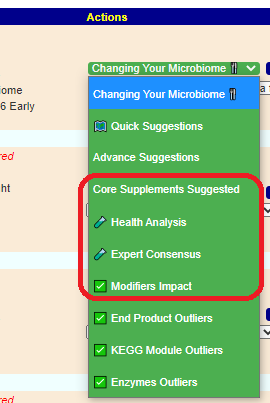
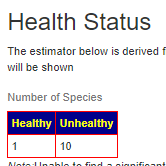
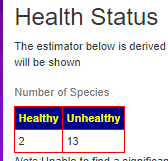
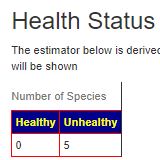
Health Analysis
This page has many sections, I am going to do it section by section.
It’s interesting that both counts increased. In one sense, we can see that the count of typical bacteria being used increased from 5 -> 11 -> 15. In keeping with my observation of the explosion of unusual species and reduction of common species with ME/CFS flare, this makes sense (See ME/CFS Relapse Report #8)
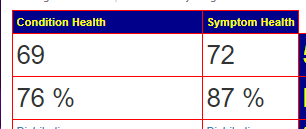
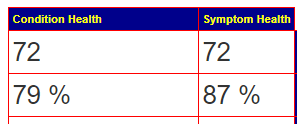
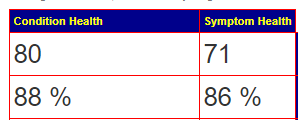
Other Estimators
This is an experimental measure intended to reflect general medical conditions and not ME/CFS specifically. I have no other medical conditions and the results were stable across all periods.
2/23: 9 not ideal10/23 Latest: 6 not idealME/CFS Flare: 10 Not Ideal
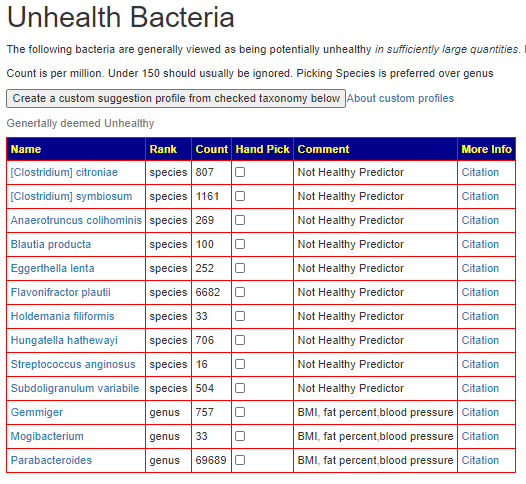
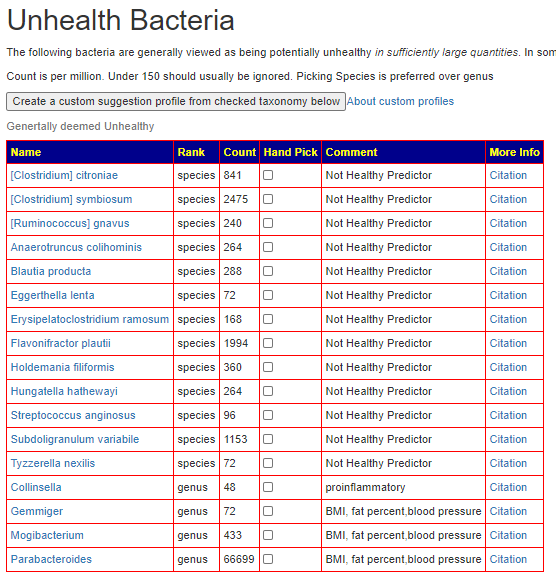
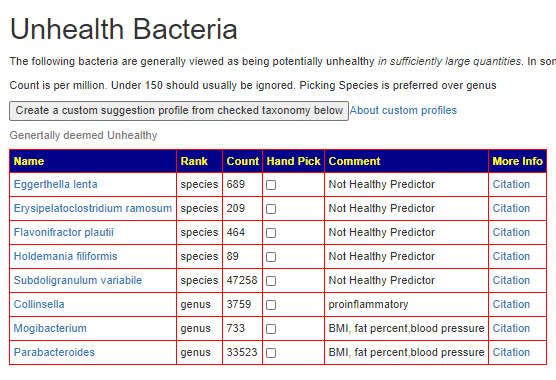
Unhealth Bacteria
This is nothing more than a listing of bacteria associated with one or more health conditions. IMHO, values less than 2000 are not sufficiently significant to be concerned about
2/2310/23 LatestDuring ME/CFS Flare
The dominant one during the ME/CFS flare was Subdoligranulum which dropped down with recovery, 47258 –> 504 –> 1153. Parabacteroides are an ongoing concern — but they are not ME/CFS associated but associated with weight and blood pressure — two items that I am working on addressing.
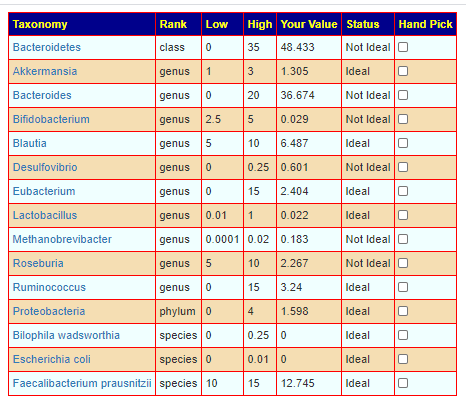
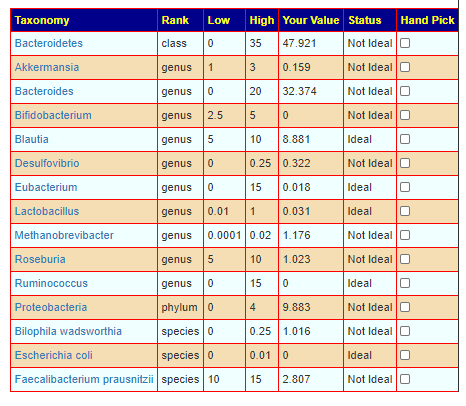
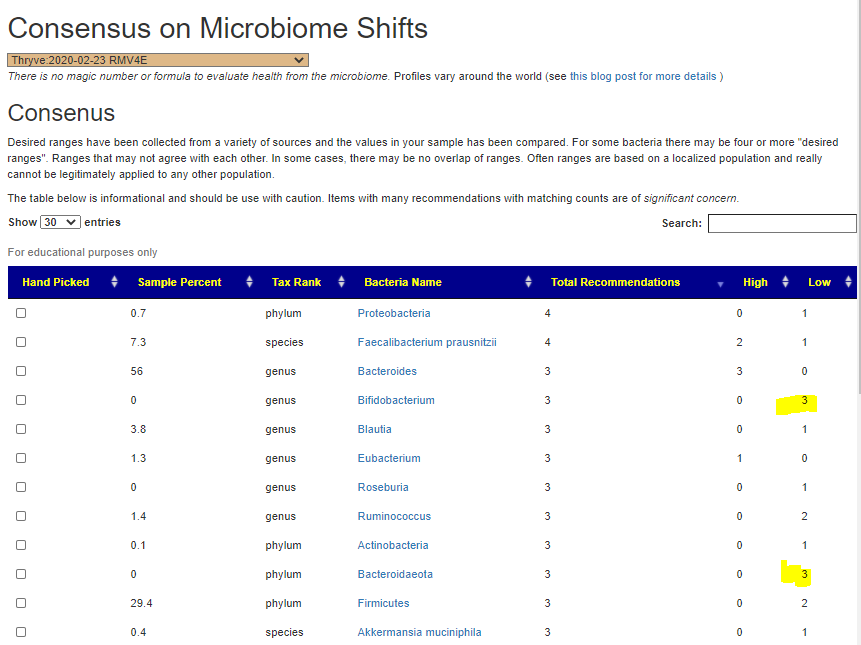
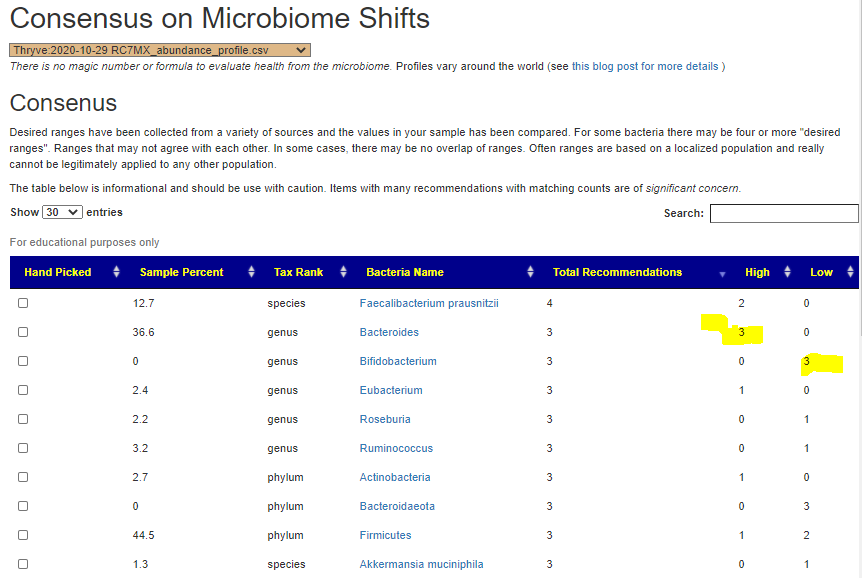
Expert Consensus
This is extending JasonH ranges by incorporating additional ranges from different sources. All of these ranges do not take into account diet, ethnic DNA etc. so they should never be taken as gospel — rather vague waving of hands.
In some cases, a value may be deemed too high by some and too low by others — there is no definitive/right answer.
During ME/CFS Flare
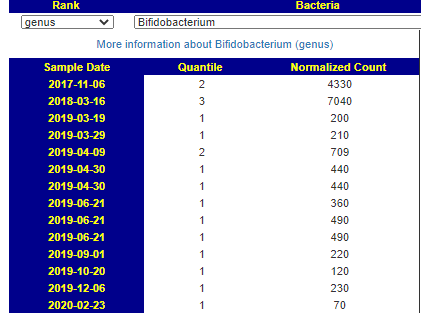
Proteobacteria was a major concern for being too high during ME/CFS, then dropped too low and finally dropped off the list (when it was in the range that everyone suggests). The other dominant item of concern is Bifidobacterium which has been consistently close to zero (< 1%). This needs some research, because age is a factor [The faecal flora of man. II. The composition of bifidobacterium flora of different age groups]
Among the vast gut bacterial community, Bifidobacterium is a genus which dominates the intestine of healthy breast-fed infants whereas in adulthood the levels are lower but relatively stable. The presence of different species of bifidobacteria changes with age, from childhood to old age. Bifidobacterium longum, B. breve, and B. bifidum are generally dominant in infants, whereas B. catenulatum, B. adolescentis and, as well as B. longum are more prevalent in adults… In adulthood, the levels of bifidobacteria are lower (2–14% relative abundance) but remain stable (Odamaki et al., 2016).
On during further research, I see that it dropped from the expected range (4.3%, 7%) with the ME/CFS flare and have not returned yet.
Bottom Line
The changes seen here are a lot less dramatic than those seen with Microbiome Outliers. The amount of change was often so slight, that conclusions are fuzzy.
I have just gotten back results from Thryve. I have processed them thru BiomeSight.com giving me two interpretations of my sample. To better understand why I prefer this, read The taxonomy nightmare before Christmas…. In this post, I will look at the Thryve interpretation.
Before starting an analysis, it is good to note what has happened between samples and any specific issues you are hoping to address. My last sample was in February 2020. At that point, I was likely close to full recovery from ME/CFS but still be careful. Subsequently to that sample:
Two hospitalization for sepsis with lots of antibiotics
Last sepsis residue included high blood pressure (hypertension).
Instead of using prescriptions to address high blood pressure (I am taking no prescription drugs of any type – making me an exception for someone in the late 60’s), I have been taking appropriate supplements for it (see Hypertension – What we know, where the items and studies are detailed) . Almost all of the items are anti-inflammatories also.
Some weight loss (15 kilos, 30 lbs) – possibly a side-effect of the antibiotics.
I have noticed that I am sleeping longer and deeper. Smart watch reports sleep quality as “Excellent”
Questions being asked:
Should I drop some of the supplements for hypertension? BP is often 100/70 today, so there is wiggle room.
Any new supplements that I should consider?
My impression is that I am in good health for my age. Still have weight to take off.
Analysis
I have added two massive sets of data from KEGG: Kyoto Encyclopedia of Genes and Genomes since February. For this post, I have had to add a few more pages to do this analysis. There are almost 4000 facets of your microbiome that are available. This is mentally overwhelming to most people. The outliers attempts to filter these down to a manageable number.
Bacteria, like people, allow substitutions for work function. We need to be careful not to get caught up in specific bacteria — “all of your beer brew masters must be born within 10 miles of Munich”. This Maori from New Zealand may be the equivalent or better job.
We need to focus on what they produce and not what they are.
I will start with pages that I call Outliers – that is, values that may warrant deeper examination.
These are all located on the first dropdown menu as shown below.
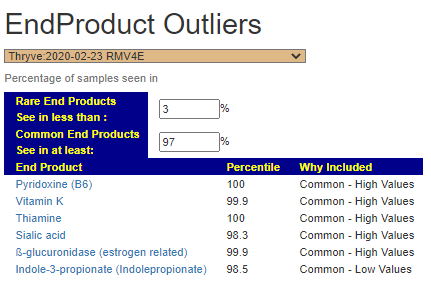
Outliers are values that are rarely seen
Values that shows up depends very much on what is reported by the software looking at the sample. There are two sets of results that I want to look at:
Those reported by almost everybody (i.e. 1300 samples or more). That is 97% shown above
For these I am concerned about very high and very low values (bottom and top 3%)
Those reported by few people (3% of 1300, or 40 samples or less). If the values are high or low is not significant because their presence is the oddity.
All of the outlier pages allow you is increase or decrease the ranges to be examined.
Items listed will explain why they were included in the list.
My goal is to identify these items for later follow up (Medical Professional or PubMed research)
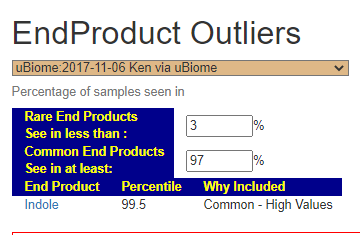
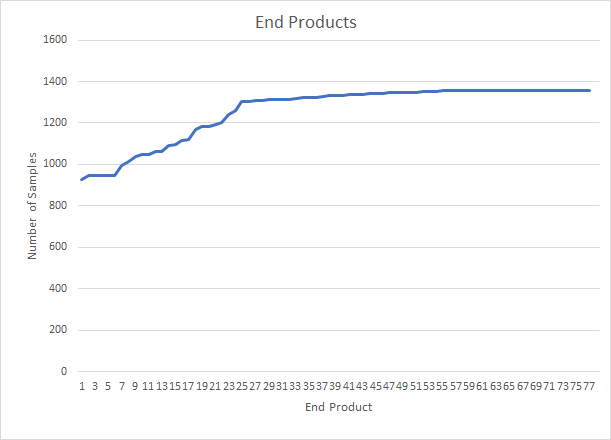
End Products
Most end products are reported for most samples.
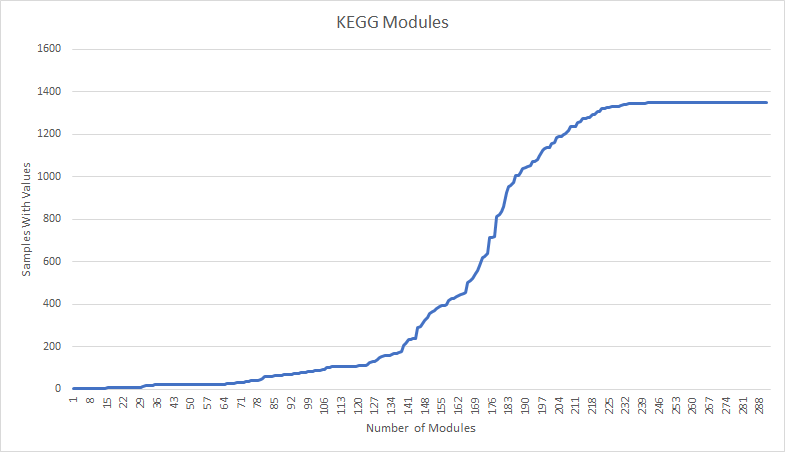
KEGG Modules
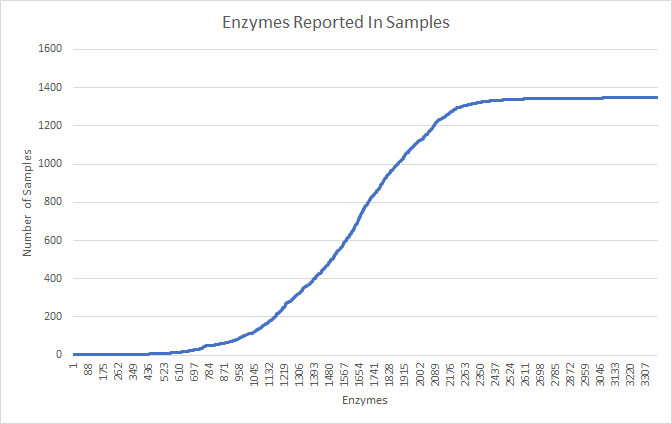
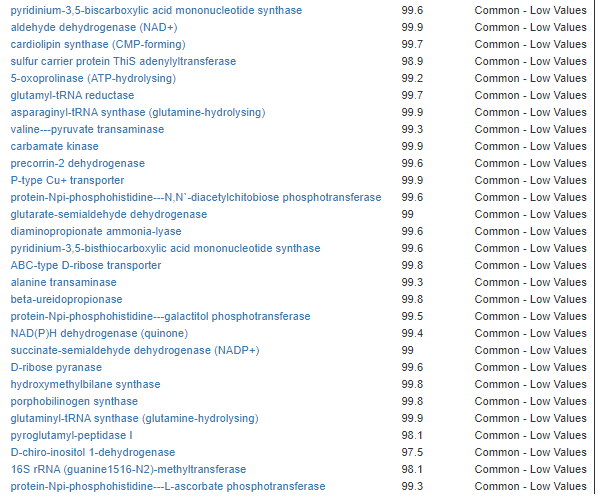
KEGG Enzymes
Actual Results – Using Thryve’s Data
Compare to February, I expected things to improve. I was actually surprise at the degree of normalization seen across thousands of measures (literally!) as shown below. February results are shown first, followed by October.
All items have normalizedAll common values have normalizedAll common values have normalized
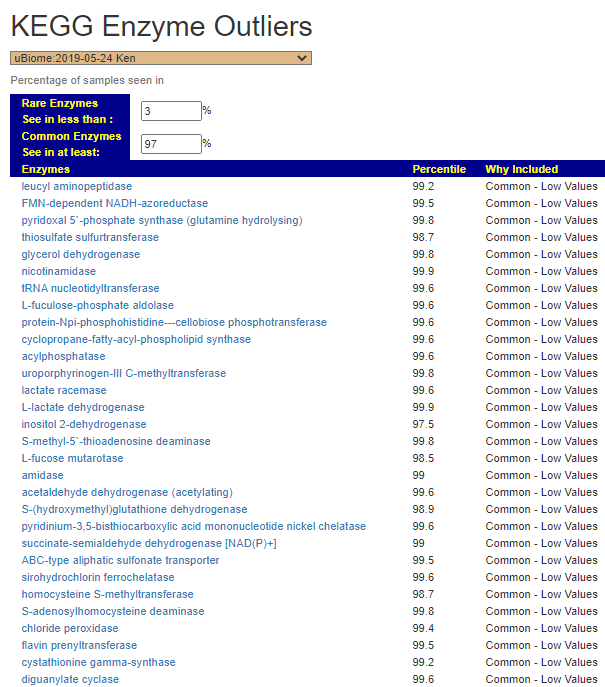
Sick Me Results
If I hop back to a time that Chronic Fatigue Syndrome was active, we see a massive number of Kegg Module and Enzymes that were low (botton 3%ile)
Bottom Line
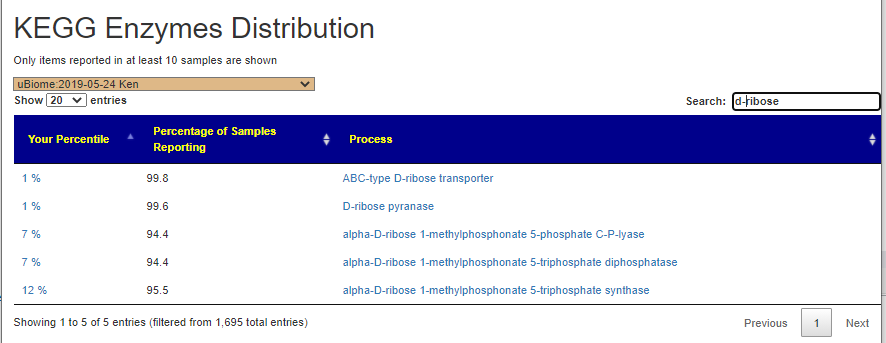
These new pages appear to work for identifying the processes that are off. Some of them can lead to immediate suggestions for supplements. For example, I noticed D-ribose enzymes on the list above, looking at more detail of this sample and filtering… I see that everything connected to d-ribose is low. Logical conclusion, supplement with D-Ribose. Surprise, surprise — the literature agrees!
Results: D-ribose, which was well-tolerated, resulted in a significant improvement in all five visual analog scale (VAS) categories: energy; sleep; mental clarity; pain intensity; and well-being, as well as an improvement in patients’ global assessment. Approximately 66% of patients experienced significant improvement while on D-ribose, with an average increase in energy on the VAS of 45% and an average improvement in overall well-being of 30% (p < 0.0001).