Condition Template Pages Updated

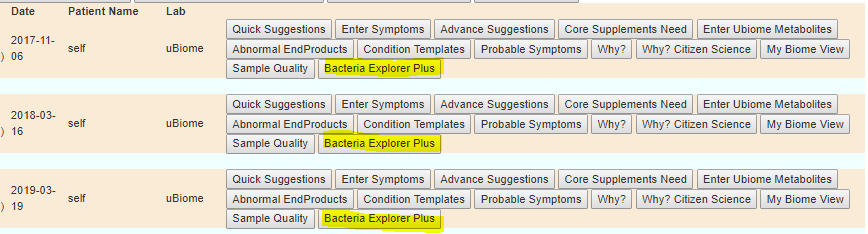
Condition Template pages are based on bacteria shifts reported as significant in studies published on PubMed. These studies usually use the non-quantified expression “higher” or “lower”, often on the averages for a group. This makes application to individual microbiome samples a challenge — especially when averages very rarely are normal distributions.

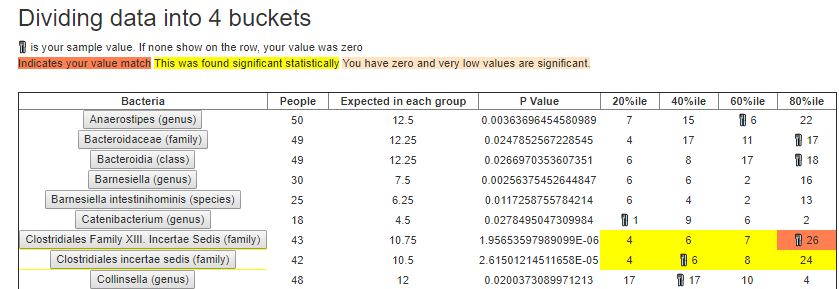
With the improved quantiles (bins of samples) enhancement, we have a way to likely use these vague study results in a robustness safe way.

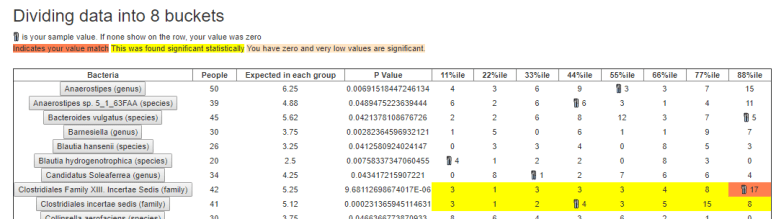
Consider a condition with 16 bacteria. If we select the 6% level, we would expect around 1 (16 x 6% =0.96) matches. With expected numbers and actual numbers, we can use a method called Pearson’s chi-squared test. Using expected numbers and actual numbers from a sample, we can compute chi-square probability of the matches being random.

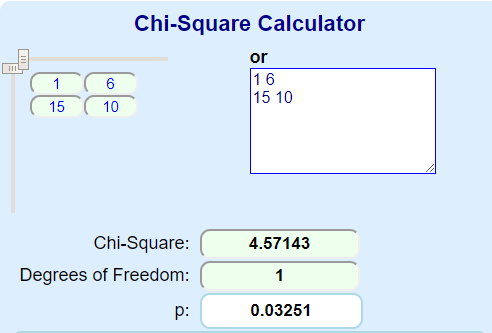
For the example below, we pretend we have 16 bacteria. We expect 1 to be found(matches) and 15 not to be found. If we find 6 matches and thus 16-6 -= 10 non-matches, we can compute the odds of this happening at random. Around 0.032, 3.2% or 1/0.032 => 1 in 32 times.

  • With 0 matches on 16 items we have 0.309
  • With 1 matches on 16 items, we have 1.00
  • With 2 matches on 16 items, we have 0.54
  • With 3 matches on 16 items, we have 0.285
  • With 4 matches on 16 items, we have 0.144
  • With 5 matches on 16 items, we have 0.070
  • With 6 matches on 16 items, we have 0.032
Compute it yourself at: https://www.mathsisfun.com/data/chi-square-calculator.html

Traditionally, a value is 0.05 (5%) or less is needed to be significant (or, of concern). There is one change in 20 or this being random. If you check 20 conditions – you would expect one to be at 0.05 or below ( 5% x 20 = 1). So you need to use a bit of common (statistical) sense if some odd condition appears. On the other hand, if a suspect condition shows up very strong then you may wish to get definitive testing (if it is available). Not responsible for MD’s confused faces when you ask for testing because you microbiome results suggest it may be wise.

Bottom Line

Using these studies results have been an ongoing challenge for me. There is elegance in the approach implemented given that we are dealing with fuzzy data from studies that are all over the place in approach, default regional diets etc.

Again, this is not intended to predict, rather just inform people when their microbiome appears to be shifting to reported disease patterns.

Suggestions:

  • The smaller the probability and the smaller the percentile (i.e. 6%), the more likely that these is a real association.
  • The association should persist across multiple samples.
  • The all in one is likely the best measure of microbiome dysfunction

I will see about adding a timeline to these measures for those with multiple samples.

Symptom Bacteria Explorer Plus

This was released on Sept 8th, 2019. The old Symptom Bacteria Explorer is still up. It weaknesses are:

  • Does not show where your values are on the table
  • Uses 4-buckets analysis only
  • Does not allow you to exclude symptoms during the exploration.

These two pages have been updated to use the new Plus version also:

Walk thru of the new feature.
Example of discovered relationships

Updated Version

This is available from the Select Samples Screen as a new Button.

Accessing Symptom Bacteria Explore Plus
Ability to select which sample you wish to add to the display
You can select which symptoms to include or excluded
Your values are shown on the table, if it matches the pattern, the background color is changed.
You can increase the sensitivity by going to more buckets.
You need to use common sense. I am not a precise match above, I am one above the precise match. Since we are dealing with very high values, being at the top level implies that it is an effective match.

Bottom Line

This is not prescriptive, i.e. directly suggesting actions. It is informative as to the cause. If you have not entered symptoms yet, consider doing so.

If you click on the bacteria button, you will be taken to the bacteria summary pages which may suggest changes desired. As always, changes of diet, supplements etc should always be reviewed with a knowledgeable medical professional before implementing.

Clostridiales Family XIII. Incertae Sedis (family)

Labor Day Site MicrobiomePrescription Enhancements

With the long weekend, I bite off some of the nastier refactoring. In the late spring, I did a trial run of quantiles non-parametric statistics with awesome results. I had arbitrarily picked 4. I have now implemented the data infrastructure to support 8 and 16 quantiles. To this, I added the site source so that mouth bacteria analysis will be automatically supported with more data uploaded.

Update of Taxonomy Data

This allows you to see how your numbers compare to others in terms of percentile buckets (3% of the population in each)

Updated My Biome View

The original version used canned images. This uses scaling and appropriate placement.

Custom Suggestions

Quick Notes on Pending Changes

I am reworking Quantiles in two different ways:

  • Computing the 4-,8-16- Quantiles
  • Computing these by Measurement Site
Example of Data

The reasons are simple:

  • Site like mouth was been implicated in certain conditions (Chronic Fatigue Syndrome,
  • Data Size is sufficient that using the large quantiles should produce more meaningful results.
    • 8 – quantile High Outliers are likely <3%ile chance (most medical tests use 5%ile for high threshold
    • 16 – quantile takes it higher but with some caution being needed

For symptom analysis to microbiome, there is some extra magic needed (i.e. I must test with, 4-, 8- and 16- with too few samples forcing the lower quantiles.

That’s it. Been grinding away this weekend and about to do a 2nd revision of the code refactor.

Stay tune

Heart Rate and BP Watch on a budget for ME/CFS

I had an old Pebble Watch with heart rate monitor – unfortunately the battery was approaching end of life (i.e. watch needed to be charged daily). I went searching for an economical replacement and found a 2019 watch whose price was, was sweet. Ordered one to see how well it worked.

After a week, a second one was ordered for the wife.

You may wish to read this post USING A HEART RATE MONITOR TO PREVENT POST-EXERTIONAL MALAISE IN ME/CFS from solvecfs.org. It does a rich set of links to studies and details methodology.

Amazon.com

The BP Pressure is not in most watches, this is a new 2019 model and using newer chips (the endless dropping of cost for features). There is a cheaper one (appears to be identical) for just $16.00.

The associated application shows your pulse thru out the day.

Having the blood pressure monitor is also sweet (you need to calibrate it using an external BP device- unless you are interested only in unexpected changes).

Bottom Line

Having automatic pulse tracking thru the day is sweet. Having BP being available when or after POTS happen is also informative. The cost is so low that arguments about how long will it last, etc… almost become moot.