
In my earlier post, COMPARING REPEATED UBIOME RESULTS, I provided a tool but little guidance on interpreting. The key question is always whether the symptoms improved, not whether some numbers change. We do not know which numbers are significant and which numbers are just natural variation.
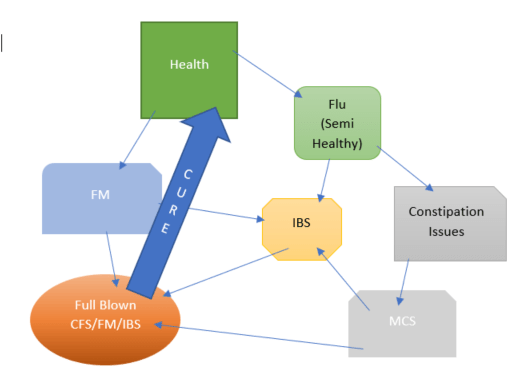
Model Of Onset
People see progression of symptoms since onset. Each progression is likely associated with a set of changes in the uBiome. This can be represented in the chart below (which likely have a lot more items than shown).

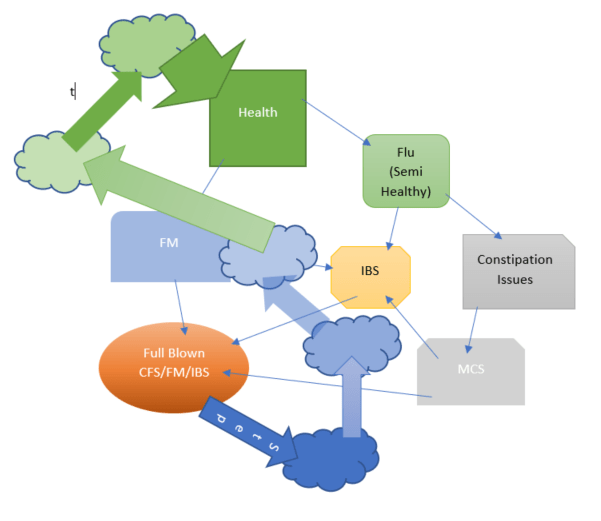
Model Of Recovery
Our Wishful Model
This appears to happen in two scenarios:
- Chemotherapy for Cancer in some cases
- Fecal Matter Transplants — but usually do not persist longer than a few weeks
Probable reality
This model comes from the model that we may have more than a dozen bacteria groups involved in the symptoms. For depression alone, we see 28!!. Being able to correct all of them in one-go is not likely. You may correct one and those not effected adapt to try entrenching themselves better (like filling the empty space of the bacteria reduced).
Interpreting results of Comparisons
I am looking at a person with two samples. I have not automated the comparisons shown below, instead I selected a sample and then went to the page and did a simple count.
- Depression Profile
- Early Sample: 11 matches
- Later Sample: 8 matches
- Chronic Fatigue Profile
- Early Sample: 8 matches
- Later Sample: 9 matches
- Inflammatory Bowel Disease
- Early Sample: 7 matches
- Later Sample: 6 matches
- Irritable Bowel Syndrome
- Early Sample: 3 matches
- Late Sample: 2 matches
- Mood Disorders
- Early Sample: 2 matches
- Later Sample: 2 matches
Over all, we went from 31 matches to 27 matches. One increased and three decreased — I wish it was possible to do decrease across all items…
Comparison Report – Summary
The original detail was done as a quickly and dirty report comparing numbers and attempts to keep people from becoming excessively focus on numbers (which we are not certain of significance – some are likely important and some are not… we do not know for sure which ones are).
From feedback, it is clear that a simpler report, the summary, would be easier to understand and likely more beneficial
Time between samples: 10 months
Metabolism is likely the most significant
Like the profiles used above, this filters ‘noise’ and looks at the net result of a lot of different bacteria. I have just added a new item to the report
Average Metabolism (Ideal healthy would be 1.0)
- Early sample 1.32
- Later Sample 1.18
In short, the metabolism is improving greatly.
New and Updated Pages
There are now two buttons available for comparison

The new report is Summary, and an example is shown below. The most significant ones are high lighted.
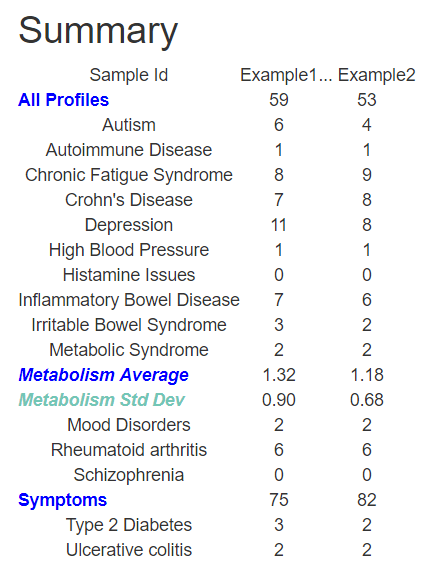
- Profiles – this means the total matches for all of the conditions we have profiles on
- We see a decrease from 59 matches to 53.
- The individual profiles are listed in plain text
- A decrease suggests moving away from an autoimmune state
- This is an objective measurement
- Symptoms:
- Symptoms are subjective, ideally we would like to see a decrease
- Go to the detail reports to see what symptoms changed.
- Metabolism Average
- This is the average of the values transcribed from uBiome.
- A perfect (healthy) score is 1.0
- This is an objective measurement
- Metabolism Standard Deviation
- This is a measure of how scattered from a healthy score you are
- A perfect (healthy) score is 0.0
- This is an objective measurement
Bottom Line
The new summary page give you three objective measures of your progress. For the reader above, all three objective measures improved. The subjective measure (number of symptoms) increased — we do not record severity of symptoms because that is so-so-so very subjective, just a count.
Whiplash on Recommendations
The reader found that the recommendations changed a lot between the two samples. A change is expected if progress is made. Conceptually, the number of items with a high (or low — for avoid) should decrease if progress is made. We see this in the samples of this reader, as shown below.
Take Lists
For Example 1, we had the > 4 take
amoxicillin
Azithromycin
florfenicol
Cranberry bean flour
Bacillus subtilis natto
Gallate
Flaxseed
High Fat
Plant-rich diet
ß-lactam antibiotics
Tannin
Trimethoprim-sulfamethoxazole
Vitamin D
Polymannuronic acid
For Example 2, the list has grown smaller, with some new items appearing
Polymannuronic acid
Ketogenic diet
Lactobacillus kefiri
Low fat diets
L-Taurine
Lactobacillus plantarum
Bacillus subtilis natto
Avoid Lists
For Exampl1, the < -4 list
Arabinoxylans
black raspberries
Acetic acid
Chrysanthemum morifolium
ibuprofen
Isobutyric acid
Isovaleric acid
Sunflower Oil
High fruit intake
barley
Saccharin
Saccharomyces boulardii
animal-based protein
High meat diet
Fraxinus angustifolia
berberine
For Example 2, the list is again smaller for < -4, with a few items in common
Walnuts
Navy bean
berberine
High protein diet
Carboxymethyl cellulose
Polysorbate 80
ku ding cha tea
barley
Fraxinus angustifolia
