A reader left me a voice mail and sounded very frustrated trying to deal with dry mouth. Fortunately it is a symptom in our Eureka database. The apparent cause is excessively low amounts the following genus:
Faecalibacterium x 163
Dorea x 81
Roseburia x 72
Blautia x 29
Lachnospira x 9
And possible high amounts of:
Akkermansia x 4
Intestinimonas x 11
Since this is at the genus level, we do have an ability to look for suggestions for this combination explicitly by going to: Enter All Bacteria [Genus] Reported Report and enter the values. You could examine your own levels and modify what is entered there to better match.
Often choice of supplements to try is based on hearsay. Hearsay can often be seeded by people with vested interests in selling a product. A seasoned medical professional may notice patterns and advocate on those — but those are often bias by placebo effects.
For people that have done 16s microbiome analysis, uploaded them and annotated them with symptoms — we can generate a list of supplements suggestions that matches both microbiome and symptoms — sweet. See this post for an example.
Today, in answering some correspondence, I realized that using the same Eureka data, we can provide hints on what a supplement is likely to help. Hints based solely on statistics. It has now been implemented on the site.
Then the appropriate group, and then a specific item
You will see a new section (sometimes — if there is data). For an example, I looked at Holigos (available on Amazon), and we see up to 10 symptoms that it may impact.
Does it work? I went thru the full list of Eureka symptoms and found that its studies and the predicted impact were reasonable matches (for what they had studied).
Bottom Line
If someone suggests that you should try ‘snake oil’ for speaking in tongues, then look up ‘snake oil’ and see if there is some evidence that it could help. If not, consider saving your money.
Note: As more people contribute 16s microbiomes (ubiome is typical) AND annotated them with symptoms, the more accurate and detail that this will become!
A reader pinged me after my last post on the new microbiome comparison tools to look at their results. I usually avoid digging into readers results because I really do not have the time. Her summary and the pair of results looked like a good opportunity to do a detail walk thru of where the site logic should take a reader.
Fundamentals
Female – born and raised in Russia, mid twenties
Living in Canada since 2010
Eating raw vegan from 2010-2017, modified paleo afterwards
2016 took sick
SIBO, Rifaximin did not help
Mast cell issues
Compare Summary
We see multiple concerning changes:
Number of bacteria matches has dropped by 12% (less selected diversity)
Number of matches to known symptom patterns has increased by 20%
Number of high condition matches has increased by 73%
Reader Notes
The last one which I uploaded on your site is 9 month ago ( sept 2018) :2-3 weeks after teeth infection and 10 days of antibiotics, which actually along with long berberine supplementing made me feel better ( bloating) but put me at 71% of diversity (from earlier 96.4%).
We see a match of diversity loss above.
What to Alter?
Looking at the data clicking Eureka, we see a shift to high levels of:
At this point, we hit a decision point — do we go with changes of high and low OR do we focus on bacteria eureka matches that also match the symptoms. Since our real concern is reducing or eliminating the symptoms then filtering by symptoms where the bacteria pattern matches seems the most productive approach to do first.
For the latest sample (where she had entered symptoms – (here is REAL IMMEDIATE VALUE to you and the community to get symptoms entered!), we see:
All of the high items are at the genus or species level — so we can get very targeted suggestions by picking:
The suggestions (excluding drugs and antibiotics) are below. We are lucky with a nice set of matches of bacteria to symptoms to known modifiers.
Back to Reader’s Notes
Even through I would still have a brain fog after canned food but I just ate everything like when I was living there (Russia) , lots of fermented dairy, sourdough bread, histamine fruits and had no constipation and absolutely clear skin. Here in Canada fruits is a driver for my acne- when I was on raw vegan food(2010-2017) I did not have constipation but I was all over in acne. I don’t think it was from a native food I ate since I had a constipation and acne when I was living there years ago, but from probiotics?! And I ate a lot of food I can not afford to eat here:.
How does this experience compared to the suggestions? First item is that we have probiotic species matches for when you improved! Second, item that jumps out is an apparent contradiction between the lists — we have take high fat diet and avoid high red meat diet. Are they not the same? Actually eating meat in Russia (higher fat) will have a very different cut than in Canada or the US (lean, low fat). In the west, style has shifted to lean (low or no-fat) meat.
There has been a shift towards beef only in the west, “white beef” (as it is referred to in Israel), a.k.a. pork consumption has decreased. In Russia, I greatly suspect that meat is higher in fat content and was more likely to be pork, especially for the former peasant classes.
The issue of being a vegan is interesting, because we see almost all of the B-vitamins listed as suggestions. She took sick while a vegan and low B-vitamin levels would be expected then. The overgrowth identified above are associated with various low vitamin B levels.
There is a large amount of literature about nutrition and vegan, for example, “Nutritional Considerations for the Vegetarian and Vegan Dancer.[2018]”. This situation may actually be reflected in the high level of bacteria that attempts to consume the B-vitamins from food… unfortunately if food with B-vitamins are not consumed, the bacteria net result may be little B-vitamins. The site report is shown below.
Where the table below is producedB vitamins are bacteria that extract from food, NOT natural producers.
My own take on being a vegan is simple — the microbiome is inherited and has been tuned to work with traditional food that your ancestors ate – very well. My ancestry is heavy coastal regions where a high fish intake was normal. On occasion I have needed to supplement with iodine — I suspect that my efficiency in uptaking iodine is diminished because my ancestors was exposed to abundance of iodine in fish and there was no need to be more efficient. A close friend is from India and is a strict vegan (and her ancestors has been for likely centuries). Her westernizing son started to eat meat when he started University (Pizza with friends lead him astray!) etc and then to “beef up for the gym”. It resulted in psychological and physiological issues — his inherited gut bacteria was not suited (I did a post on the best diet earlier, that may be worth reading).
Choosing to become a vegan is often a philosophical choice that ignores the reality of the inherited microbiome and even DNA. All bodies are not created equal.
Reminder: The suggestions are based on studies done in isolation. It is vegetarian versus control, or high fat versus control. With the locations and base diet of ‘control’ likely being different in each study. Suggestions is a list of alternative paths. Almost all studies controlled for just one item only, not combinations.
Probiotics sensitive to inherited regional microbiome?
This reader also appears to confirm the human population base sourced for probiotics being significant:
I was along prescribed local probiotics in liquid active form. They believe this form is much more effective than a dried powder/tablets. Human strains ( they don’t show strains numbers) : Lactobacillus Acidophilus, Lactobacillus Rhamnosus, Lactobacillus plantarum, Bifidobacterium Bifidum and Bacillus Subtilis…. I ordered the same name probiotics from custom probiotics – don’t see the same result even though the BCFU count is higher.
Russian girl using probiotics extracted from human sources in Russia does not do as well on same species sourced from US human sources!?! See this post for more discussion.
This suggests that she should try to get probiotics shipped over from Russia. Alternatively, I would try Seed probiotics for a month (which conforms to the recommendations) and if no significant impact, get their refund. It is very interesting to note that the probiotic strains that caused her to feel better in Russia — are on the to-take list!
L. Keferi vs Commercial Kefir
Lactobacillus Keferi LKF01 (DSK 32079) is on the list, this is explicitly the one isolated and available in Italy from hundreds researched (see this post). Whether an arbitrary kefir product contains it is very questionable – they likely contain L. kefiranofaciens – a different strain. This reader improved with russian made Kefir (done in the traditional way I suspect). Commercial “kefir products” are very different, see this 2015 article for some history or this pdf. L. Keferis are often in dominant in Russian kefir which typically does not have L. kefiranofaciens. This latter one is often seen in western Kefirs.
I am not sure about how strict Canada is for importing probiotics from overseas for personal use. In the US, there has been no issues for me getting them from Germany, Japan or Italy. There has been issues finding sources willing to ship.
Is the DNA of food the same between countries?
This was an interesting question that she asked. The truthful answer is no if you comparing western supermarket food to a region-specific heritage food. Let us look at a simple stable: potatoes!
There are about 5,000 potato varieties worldwide. Three thousand of them are found in the Andes alone, mainly in Peru, Bolivia, Ecuador, Chile, and Colombia. They belong to eight or nine species, depending on the taxonomic school…. Around 80 varieties are commercially available in the UK.[35] … variation in the comparative ratio of two different potato starch compounds: amylose and amylopectin…. Different potato varieties contain different levels of glycoalkaloids.
In Russia, there are 113+ varieties [2017]. The same applies to just about every fruit and vegetable.
There are additional compounding issues, for example breeding for shelf-life, color and shape [Especially true in North America]. All of these have side effects on the nutritional aspects and metabolites in them. An article on the history of tomato breeding is informative. In some cases, there has been lost of flavor (and more) as this 2019 study reports in Nature emphasises.
Additionally, we have vegetable and fruit waxing which covers (contaminates?) the product with shellac wax or carnauba wax [see this article on some history]. Some people have allergies to these, or they may trigger mast cell issues.
The ideal solution would be to grow your own using seed stock from your home country. Unfortunately, this runs into problems trying to import them. As a child in Canada, I remember going with my dad to a farmer (a Dane, like my dad) and getting some of his potatoes that had been smuggled from Denmark. My dad always complained about canadian potatoes not having the right taste and feel.
Bottom Line
Her current state is almost the opposite of mine (major physical fatigue at present but no cognitive symptoms!). That is the nature of microbiome shifts – different shifts yields different symptoms. There is no one size fits all!
Most disturbing: adhd, brain fog, memory worsening, constipation,anxiety and joints problems. And I do NOT have a fatigue.
Reader’s main concerns
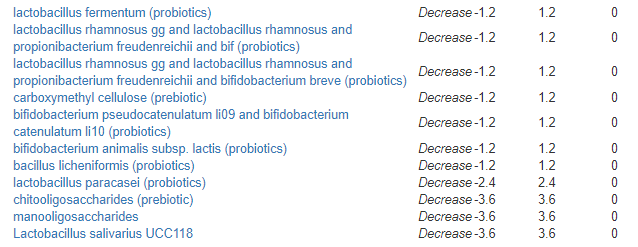
Ken’s Current Suggestions — many items to decrease are on this reader’s increase list.
Suggestions going forward:
Therapeutic dosages of the B-vitamins,
Melatonin at bed time.
Resveratrol/grape seed extract
Russian made Kefir, if available
Have 3-4 servings of eel, fatty pork, lamb or goose a week (chicken, rabbit and fish are low fat)
Heritage fruit and vegetables ideally from organic farms.
After three weeks, redo ubiome to see what changes has happened.
There were enough items to change by working from microbiome + symptoms to identify a short list. There was enough material in the database of modifiers to give a reasonable size starting list of changes.
The typical results is ‘bio-forming’ your guts to be more friendly to the cause. This can result in bacteria shifts across multiple taxonomies which may persist after the root cause has been eliminated.
Excluding antibiotic induced diarrhea
“However, the quantity of Enterococcus and Bifidobacterium groups were significantly higher in healthy controls than in diarrheal group (p = 0.000076 and 0.001, respectively).” https://www.ncbi.nlm.nih.gov/pubmed/31062602
AUTHORS׳ CONCLUSIONS: Moderate quality evidence suggests a protective effect of probiotics in preventing AAD (in children). [2016]
Based on high-dose probiotics, the number needed to treat (NNT) to prevent one case of diarrhea is seven (NNT 7; 95% CI 6 to 10). However, a GRADE analysis indicated that the overall quality of the evidence for the primary endpoint (incidence of diarrhea) was low [2011] – that is 1 person in 7 showed benefit.
While Bacillus lecheniformis significantly reduced the incidence of AAD in patients older than 65 relative to no treatment, L. acidophilus, L. casei Shirota, S. cerevisiae (boulardii) lyo, mixture of L. acidophilus and B. bifidum, and mixture of L. acidophilus CUL60, CUL21, B. bifidum CUL20 and B. lactis CUL34 were not effective in reducing AAD in this population… a mixture of L. rhamnosus R011 and L. helveticus R052 did not demonstrate efficacy in preventing AAD in adults of all ages
Probiotics did not have a significant effect on incidence of gastrointestinal disorders when compared with placebo only;17 on incidence of gastric pain when compared with no treatment only[18 on incidence of cramping, nausea, fever, soft stools, flatulence, and taste disturbance when compared with placebo or usual care;10 and on incidence of undisclosed adverse events when compared with placebo or no treatment.
This is usually caused by bacterial infection. See this paper on treatment.
Bottom Line
These results are contrary to my expectation, i.e. urban-myth about the effectiveness of probiotics. Zinc, Enterococcus faecalis probiotics , and high dosages bifidobacterium appears to be best course.
Human nature likes simple answers with simpler solutions. If you state that SIBO is caused by an overgrowth of Enterococcus faecalis and that berberine kills this bacteria – a lot of people will take it as gospel even when faced with dozens of studies listing over a dozen different bacteria involved.
Many people using my site are looking for simple, easy, effortless analysis and resolutions. The reality is that we are dealing with an extremely complex and interacting system that is constantly changing.
Your microbiome is constantly changing — usually at a slow rate. The association of microbiome dysfunction with symptoms and medical conditions is getting stronger and stronger. It has already open treatment options for some almost untreatable conditions.
Purpose of Microbiome Comparison Pages
These pages purpose are two fold:
To more easily identify what is changing as a result of probiotics, diet changes, and even work stress.
To try to identify which of thousands of bacterias may be responding to these changes. If the changes are bad, then we want to know how to change things.
The microbiome comparison pages have gotten a face lift. They give more data and are easier to use. If you have two or more samples uploaded, you will see the button shown below on the Available Samples page
Clicking it will take you to a new page showing some high level statistics. In general, the lower these numbers, the better you are. These are the high level simplification into just 4 numbers for each of your microbiome samples.
How many “Match Taxonomy” should you expect?
The chart below shows what is in the uploaded sample. Some key statistics:
Average is 142 (It is 146 for those deeming themself to be healthy)
Median is 147
Bottom 10% is 114 or less
Top 10% is 167 or more
Symptom Matches
This uses the data from our Eureka discover that some symptoms have a statistically significant match to some bacteria. See this post for more information. For some 200 bacterias that matched to some combination of bacteria we do the following:
Count how many of these bacteria that you have (Match Taxonomy)
Count how often your values matches the pattern discovered, then convert it to a percent.
For a totally representative microbiome, we would expect to see 25%. We used 4 “bins” to get the Eureka data. We put the same number of samples for a specific bacteria in each these bins. This means that we would expect to have 25% of our bacteria match up if things are random.
We see 75% on one sample — Think of a four sided die that comes up 75% of the time — does that sound like a fair die? No. Neither does this sound like a healthy microbiome.
A second dimension of this measure is the number of matches. Above we see as low as 136, below, another person has 173. This is a proxy for measuring microbiome diversity — the higher your count, the more diverse you are.
Condition Matches
From medical literature studies we have gathered a list of bacteria reported to statistically significant over or under representation in some study. We do not know what would be expected on a healthy population, nor can we compute odds. Comparing independent microbiome studies is very difficult to do. These numbers are a general feel set of numbers. A downward movement of the numbers is usually deem to be good — you are moving closer to “control” values.
My Own History
The example above is from a reader that showed some contrasts. Let us look at mine since I was in remission for 2 samples and then have a flare that is on-going (but improving) – with 3 samples (a 4th was mailed today)
The first two numbers above were my being in remission from ME/CFS. The first set showed increasing microbiome diversity and less symptom matches (good); the second showed more matches to conditions (bad). I would deem the change between the first two as being inconclusive.
With the flare, we had dramatic changes: Diversity dropped and symptom matches increased (bad). On the condition front, it seems like we are improving but the change is very dramatic (bad).
Looking at the three flare microbiome samples, we see the second one being the worst with the third one showing sign of recovery (i.e. moving back closer to the pattern seen during remission.
At onset, the number of bacteria shifting towards symptom association increased by almost 10%.
At the same time, various low bacteria associated with conditions increased considerably.
Lots of changing symptoms
At the 2nd sample, even more symptoms hits occurred
We had the appearance of instability — high bacterias dropped by 80% and low ones started to increase.
At the third sample, we seem to be heading back to restoration of the former (pre-flare) values:
A 11% drop in bacteria matches suggests that bio-diversity was taking a hit.
Condition Bacteria continue their restoration to pre-flare levels.
All of this comes out of 4 numbers for each sample.
Eureka Page
This page compares your values to those seen with statistical significance. Remember, all of the samples are divided into 4 bins with the same number of samples out in each. If one bin has many excessive samples for a certain condition, it may be marked as such (after testing for statistical significance). This page shows which bacteria you have matches for — you are expected to have some by random chance (25% of the total) – in this case 160/4 = 40. So we can not say any item is significant by itself.
Very High: Match the top 25%
High shift: above median but not in very high
Low Shift: below median but not in very low
Very Low: Match the bottom 25%
A bacteria may be Very High for one symptom, and High shift for a different symptom.We can see instability of the microbiome on the 2nd flare sample. Some moved into very high for a short period and then disappeared.
My suggestion would be to start crossing out Low-Shift and High-Shift until you get the expected number (40) – working downwards from Phylus -> Class -> Family -> Genus (I may mechanize that in a future update). What is left over are likely the main bacteria that contributes to health issues.
Conditions
This compares against templates for various conditions based on multiple studies. We see a major jump in bacteria associated with various conditions in the first microbiome done during the flare – i.e. almost 50% increase of bacteria with a high association, this quieted down in subsequent weeks – but these overgrowths likely contributed to the flare.
Do not read in too much – it is NOT predictive
Comparing Symptoms
This is effectively a symptom tracker. The usefulness depends on the accuracy of information entered. It also allows us to do citizen science.
Comparing Bacteria
This done old school — using averages. It may be revised in the future to use BoxPlot methods (which should quiet down the noise).
Comparing Metabolism
If you have entered metabolism data from ubiome, then you can see how these functions have altered. The terms are those used by Ubiome and you may need to google to understand them and what they mean.
If you want to know how to enter this data, look at this post (which now has a rough video included).
Bottom Line
Everyone is different and there can be no one path fits all formula. We can provide information of what changes — and potentially offer suggestions of how to correct things. These are suggestions only — because we do not know, nor can we expect to know in the next century.