
I have a M.Sc. in Statistics and roll my eyes with the ranges being given by most commercial labs. I know precisely the process that most are rote-following:
To set the normal range, take samples from a group of people with no known issues. Compute their average and standard deviation. Abnormally low is average – 1.95 standard deviations and abnormally high is average plus 1.95 standard deviations.
Other approaches use just 40 people with the values of the 2.5%ile and 97.5%ile being used. Unfortunately, with 40 people that becomes the lowest value and the highest value. At both ends, that is a volatile number 😦
My goal with MicrobiomePrescription is to show the numbers from over a thousand samples and let people determine if the numbers are actually unusual by visual inspection.
What should be seen is illustrated below. The average line should be close to the 50%ile with this large of a sample. Two views are usually best.


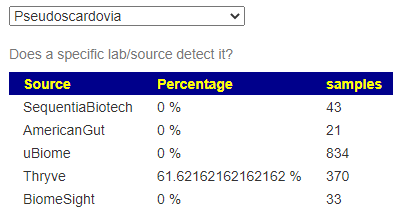
Atypical Bacteria
This bacteria is only reported by one lab, Ombre Labs was Thryve Inside. If is actually is a sibling to Bifidobacteria genus, both are children of Bifidobacteriaceae.
For another bacteria, we have the average a long distance from the 50%ile and we see what looks like three patterns — each with their own straight line (and not one like above). To get the true 50%ile (including those with zero count) it’s (50+38.2)/(100+38.32 [for Zeros]) = 63%ile on the chart.


Is it bad to be atypical? If there is not a medical condition or illness associated with it, then likely not. Variety is the spice of life, and the reality of the microbiome.
Some Extreme Examples


Bottom Line
Bacteria have a wide variety of growth patterns. Without inspect of the distributions and related information, you may either assume that there is no problem (because the lab ranges are poor — a false positive), or there is a problem when you may have 40% of people have less or more than you (– a false negative).
Do not expect labs to look at the distributions — they only have time to print the numbers and give a canned interpretation. For the microbiome, a canned interpretation is dangerous because of the impact of diet can have. I have oatmeal for breakfast every day, dark 100% rye sandwich for lunch, indian food with chicken for supper. I am pretty much wheat free… and that absence will shift my microbiome greatly.
You have to look at them yourself. You can look up most bacteria reported by labs at this URL: https://microbiomeprescription.com/Library/Lookup
