Early this year I shouted EUREKA — I found it in greek. I used non-parametric statistical methods and found strong association between certain mixtures of bacteria. How strong? Statistically the chance of some happening by chance was 0.00005%. Many medical studies are published with the chance being 5%.
Over the weekend, someone asked if I could give suggestions for probiotics for mast cell issues. She had no microbiome results. While I was solving some of the site issues, I realized that I could give suggestions with good confidence that they would fit — in fact, may produce better suggestions than a microbiome sample. Why? Noise – often we have 600 bacteria/taxonomy is a microbiome sample and the nasty problem is what to focus on. This is compounded by a lack of research papers on the human impact on many of the bacteria.
Using symptoms only, we have a small subset that are likely the ones misbehaving. These are not bad bacteria, just bacteria that are too abundant or sparse. We want to inhibit or encourage them — not eliminate them.
If you go to the Very Strong Bacteris to Symptom Association page, you will see a list of around 150 symptoms. Some symptoms are missing because not enough people with those symptoms have upload a microbiome and provide their symptoms — for example, Epilepsy has just one. The threshold is 16 samples with the same symptom.
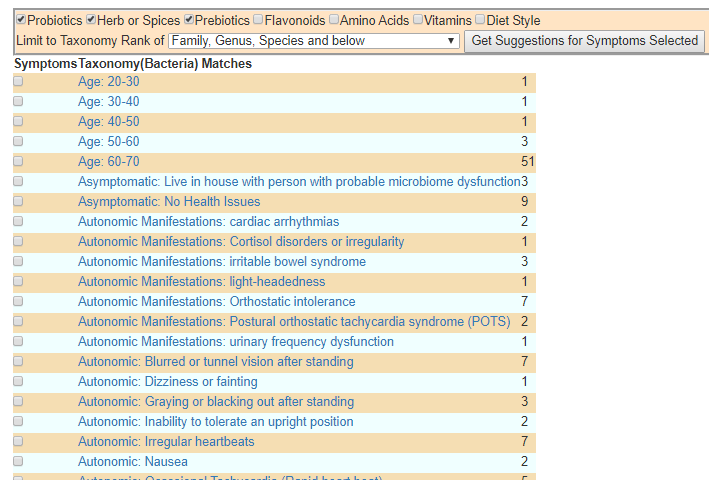
Example of identified relationships
All that you need to do is:
Check the symptoms that you have.
Select at the top what type of modifiers that you are interested in
Click get suggestions for Symptoms Selected.
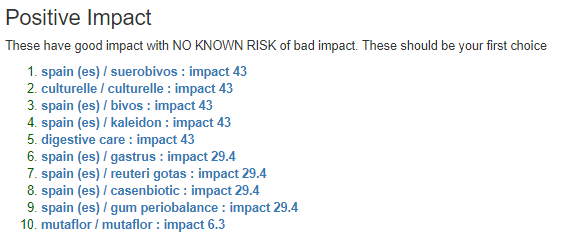
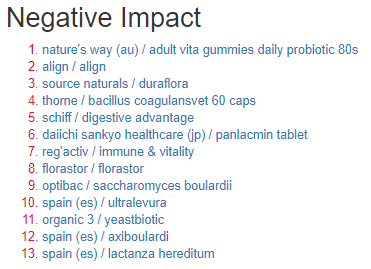
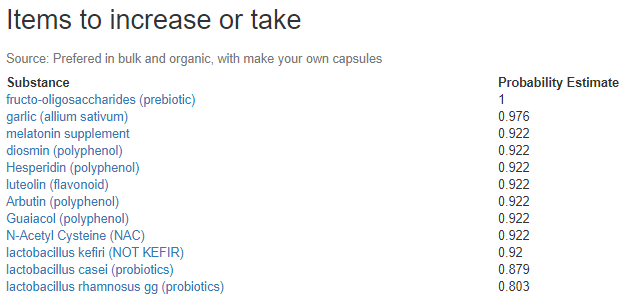
To answer the question asked about probiotics for histamine issues we see just one recommendation with no known downside. We have others that have a little risk.
A Video walk thru
Bottom Line
All of this material is theoretical produced by using an Artificial Intelligence Engine and have not be validated by clinical studies. These are suggestions. Before doing any of these, have them reviewed by a qualified medical professional familiar with your medical condition.
Back in 1999-2002 period, a chap called Dave Williams (Cap’n Dave) advocated some specific treatments to help CFS patients. He was active on the old Yahoo group that I was a co-moderator on, https://groups.yahoo.com/neo/groups/CFSFMExperimental I ended up incorporating his suggestions into my treatment regimen then. He arranged bulk purchase of supplements (L-Glutamine, CoQ10, Spezzatina (Licorice) etc. and send them free to people that made donations to his ocean health charity (SeaQuake) at that time.
Like me, he ended up successfully treating himself and also has a Master of Science which tends to bring with it a systematic approach to this illness. He has moved on with his life, but I thought a shout out of thanks was due!
With all of the microbiome research, his suggestions are in good agreement (for a significant subset). Today the lists of issues to address will be much longer than his summary in 2000.
You fail to understand that NO SINGLE TREATMENT will ever get fantastic results when used on a PWC! The single therapy approach is doomed to failure because CFS is a multiple problem caused by many months or years of hyperimmunity! People that say they have sudden onset CFS simply do not realize that they were sick for along time and never recovered. The illness they associate with the start of their CFS was simply the straw the broke the camel’s back. If you want to recover from CFS you must address hyperimmunity, poor red cell health, hypoadrenalism, hypothyroid, hypoglycemia, poor NK cell activity, and multiple nutrient depletion. And, you must address all these factors at the same time—otherwise your recovery will be limited.
What was unknown (not possible to test even!) was the microbiome aspect which links many of these to specific microbiome shifts. So each shift needs to be addressed. Some examples:
Today the option to download as JSON or CSV disappeared from the uBiome site. The ability to download the raw sequence data was there.
Over the last 30 minutes, I processed one of my samples via https://metagenomics.sequentiabiotech.com/ . (Which offers free accounts – up to 2 GB of data, the download files from uBiome uploaded is just 12 Megs, so the free account will work for most people.)
The main thing is for people not to go into a panic. It appears that uBiome is planning to add back the download options. If they do not, there are possible alternative solutions.
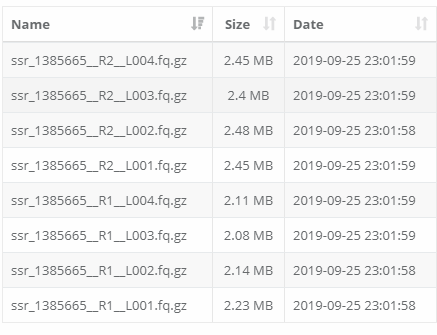
My Samples Listing for ONE ubiome sample
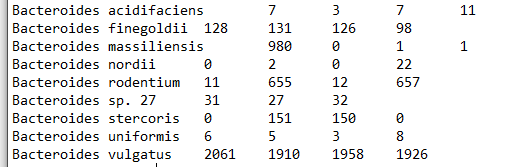
It generates many files, for example below are some of the files sample. uBiome does 4 passes, and the numbers from each pass is shown below. How you boil the four numbers into one is an art – arithmetic mean, median, geometric mean, etc are possible choices.
species.countstrains.count
I look at my ubiome JSON file for the same data and I get:
Bacteroides acidifaciens 30655
Bacteroides faecis 38174
Bacteroides finegoldii 21914
Bacteroides ovatus 192887
Bacteroides sp. J1511 91
Bacteroides sp. ‘Smarlab BioMol-2301151’ 30
Bacteroides thetaiotaomicron 153659
Bacteroides vulgatus 30
This is not surprising, because the raw data fragments are looked up in different reference databases. By the way, there was no E.Coli listed here either!
Bottom Line
I will do a walk thru video this coming weekend for people interested in exploring a different analysis of the raw data. It is a multiple step process that takes about 30 minutes per sample.
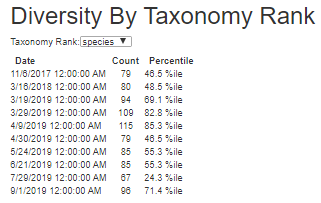
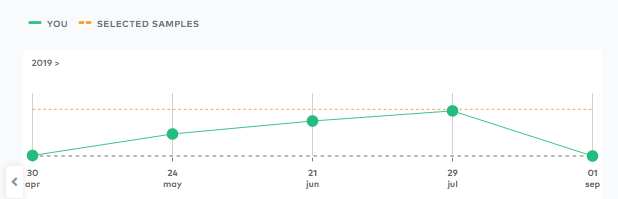
I should also mention that immediately after I took this sample, I altered supplements dramatically because ‘something felt like it was going in the wrong direction’. This lab results confirmed it when I look at Diversity by Taxonomy Rank, a 43% jump!
Diversity increased dramatically
Why is diversity important to monitor? Don’t you want high diversity? To me, the answer is no and appears to be backed up with this study on humans. “Increased Diversity due to increased abundance of less dominant taxa [as a result of stress]“[2017]. Since stress has always been the trigger, the increase of diversity should be a warning sign. More bacteria types means alterations of metabolites and chemical system — dysruption of a well operating microbiome. More is not better always.
A healthy gut ecosystem is rich in diverse species.[1][2]
Ubiome.com — I believe this is an over simplification
What Did I Change
I went over to my heavy duty kill evil bacteria supplements, namely significant dosages of:
Tulsi
Haritaki
Neem
Triphala
Wormwood
Olive Leaf
EDTA and NAC as biofilm breakers
Also because of a high blood pressure reading (predictable from microbiome) from an urgent care visit. I also added in (see this post for why):
Melatonin
Grape Seed Extract /Resveratrol
CoQ10
Fisetin
Lycopene
Pomegranate Extract
Piracetam
Nattokinease
The results were good:
Went from struggling to get to 6000 steps per day to over 10,000 steps on many days
Smart watch blood pressure readings dropped by at least 7mm
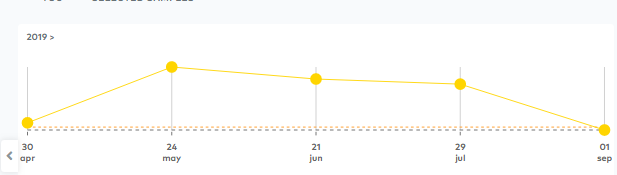
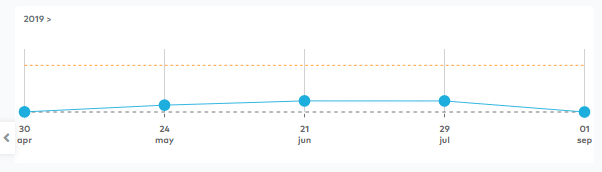
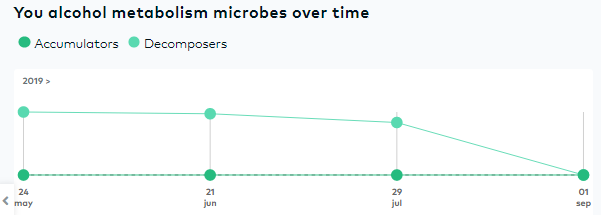
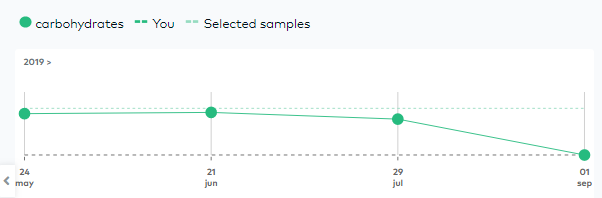
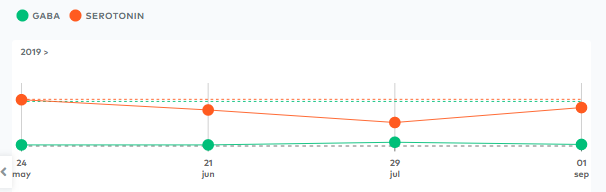
Ubiome Reports
Remember this reflects what was happening when I felt something was going the wrong direction and altered supplements etc. My gut feeling appear to have been very correct.
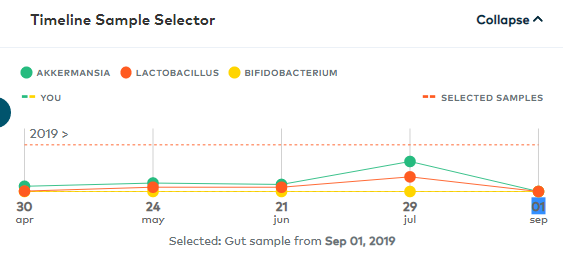
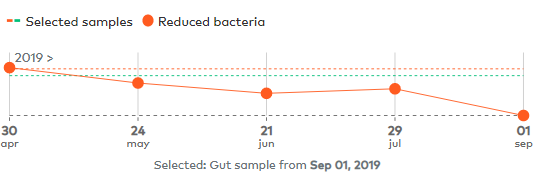
Propionate CollapsedPolyamine CollapsedButyrate CollapsedLactobacillus and Akkermansia collapsedAlcohol Reducing Bacteria also collapsedMore CollapseAnd still more: Carbohydrates, Lipids and Amino Acid < 10%Some good news – finally! Serotonin has improved
Vitamin K2 and B9 also reported as < 0.05 of selected samples.
Microbiome Prescription Site
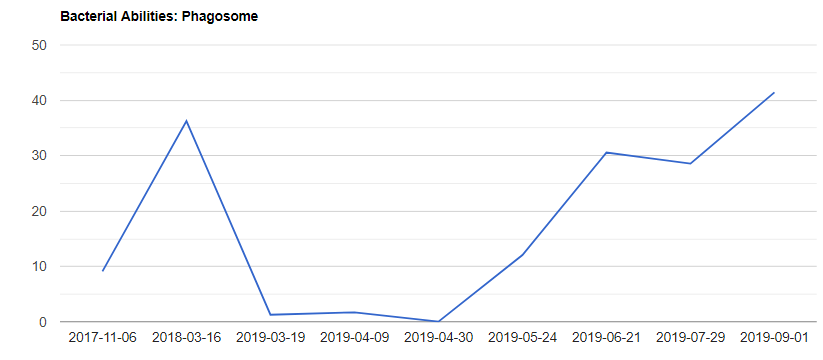
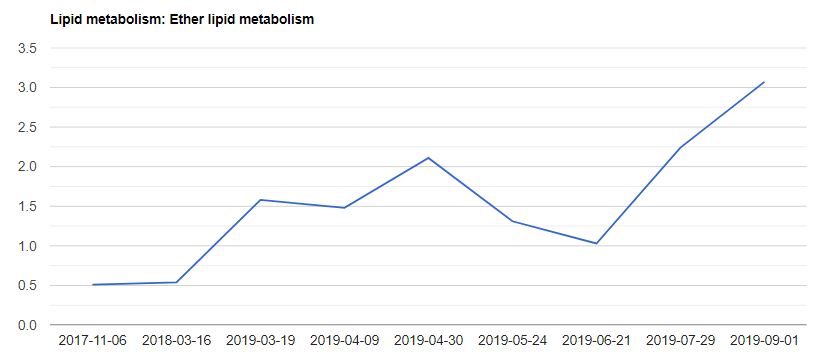
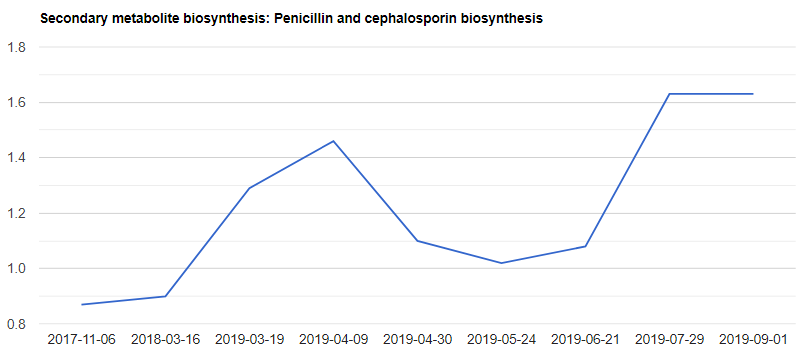
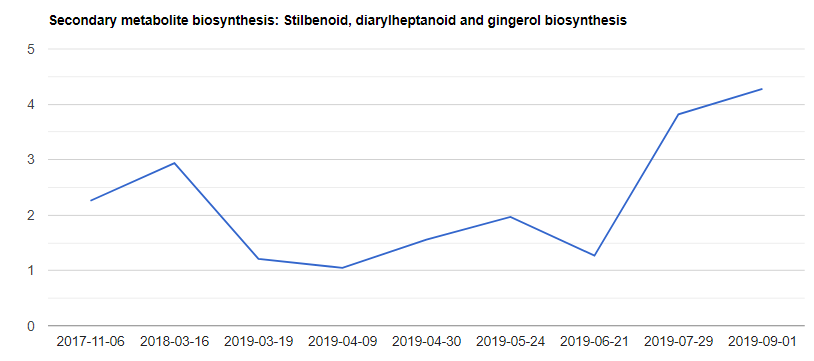
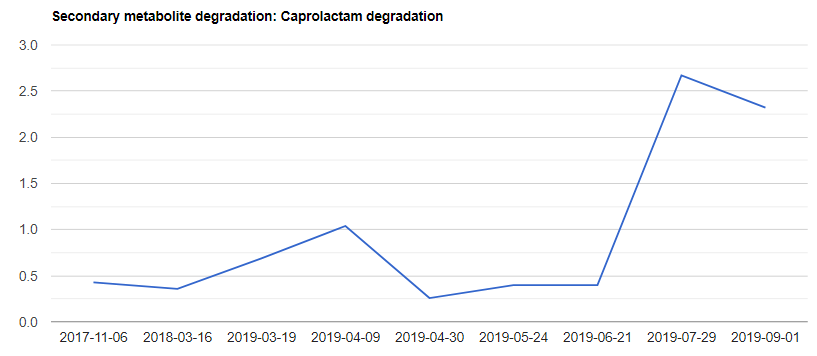
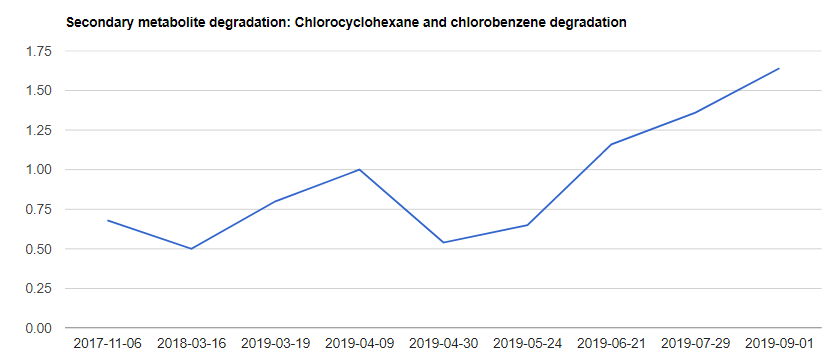
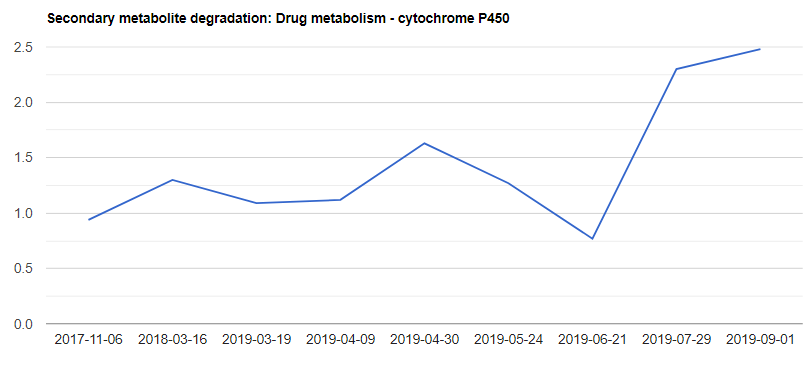
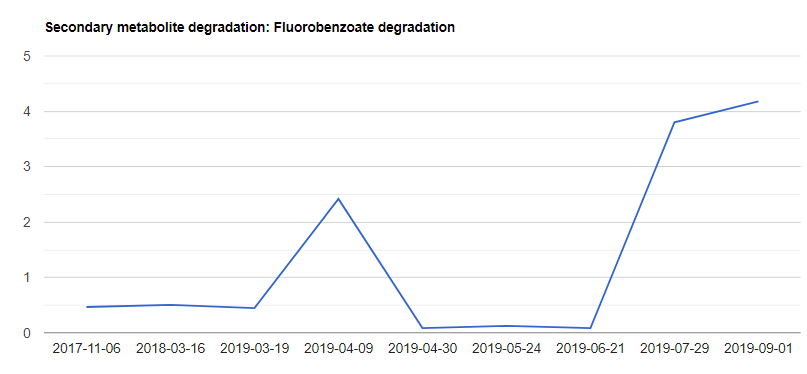
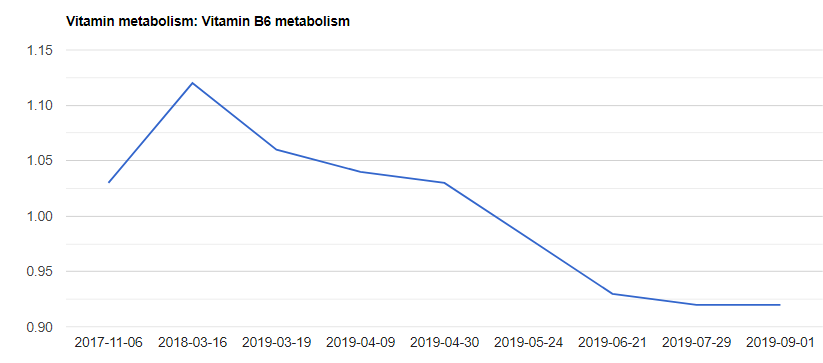
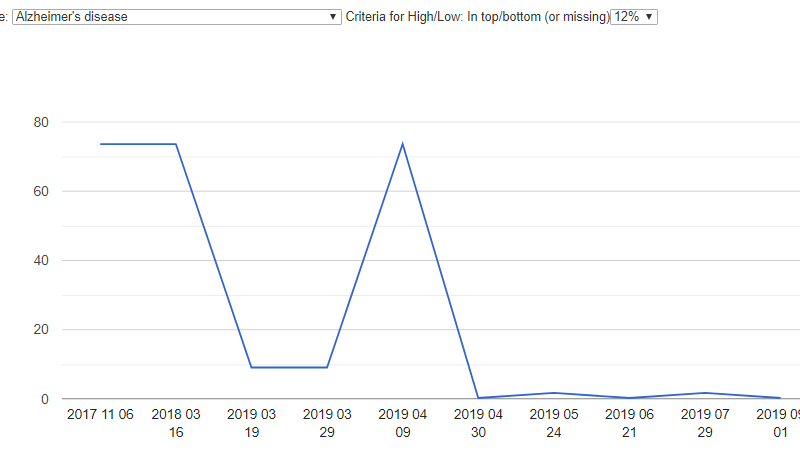
First, it’s the charts of uBiome Predicted Metabolic Functions, scanning for interesting things – there are a lot…
Back in 2012, I had a SPECT scan that was read as mild or early Alzheimer’s disease. I believed that this was caused by a microbiome shift. With the templates and samples, it appears to be confirmed. My microbiome has shifted to match that seen in Alzheimer’s. I am not explicitly concerned because I am working on restoring the microbiome.
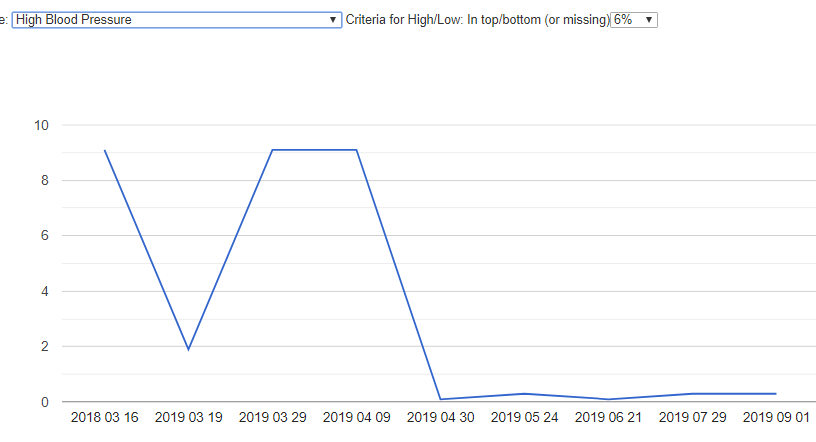
High Blood Pressure
A recent urgent care had the physician concerned about my having high blood pressure. A little checking up found that some items that I was taking are known to include blood pressure (which I stopped), and then looked at my microbiome — as it appears that the root cause was the microbiome shift.
Changes in Suggestions
There was no striking difference in suggestions. That is not totally unexpected — the increase in biodiversity was likely in the minor or elusive bacteria. There is little literature on those. 😦
Ubiome reports 5 very elusive bacteria and 10 under 7.5% in the latest sample. The prior has ZERO elusive bacteria and only 2 under 7.5%. The one before has 1 elusive and 3 under 7.5 which was the patten back until 4-09-2019 (2nd and 3rd samples after relapse) when we also had 5 elusive and 10 under 7.5.
Bottom line: The goal is to suppress these elusive bacteria and reduce diversity. Looking over suggestions, I see that I may wish to also add:
Rhubarb
Oregano
One item that I became lazy about in the weeks before the last sample was having Barley Porridge every morning. It is high on the list and is the only change that I can identify. It was time consuming to prepared and I felt well enough that I thought that I could skip it — classic ME/CFS mistake.
A reader asked me to write up a description for their MD. The PDF version is available here. Below is a text version
The difference between older Gut Labs and 16s Labs
Ken Lassesen, B.Sc. , M.Sc .
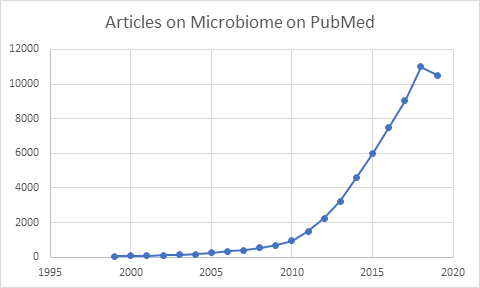
Interest in the microbiome has grown greatly in the last few years. Two decades ago, there was rarely 5 articles a month. Today it is close to 40 articles a day. A new laboratory technique called 16s has contributed to this explosion of studies.
Practicing physicians finished their education before 16s usage became common. People like the familiar, and will tend to use tests that they have a long history with. A test like Genova Diagnostic Comprehensive Digestive Stool Analysis, has been in use since the early 2000’s with some changes over the years .
Methodologies • Older Tests: utilized the standard culture method o Many bacteria cannot be cultured, in fact most cannot be. • “The 16S rRNA gene is a short section (~1500 base pairs) of prokaryotic DNA found in all bacteria and archaea. The 16S rRNA gene is a commonly used tool for identifying bacteria because analysis of an organism’s DNA is often more definitive than classification based solely on phenotypic characteristics.”
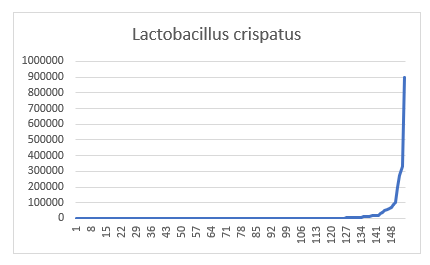
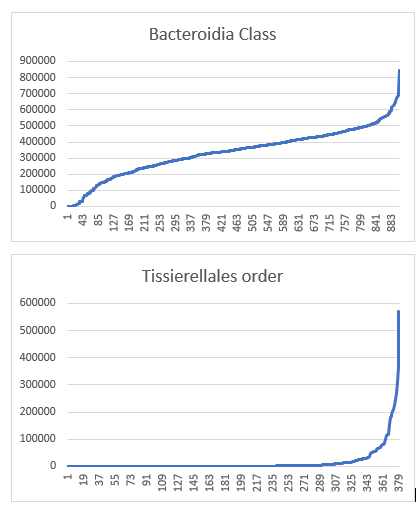
Translation: • Older Tests often report on 20-30 bacteria only • 16S Tests typically report on 3000-4000 bacteria Distributions and Determining Outliers The traditional labs follow the tradition lab process to set limits of what is normal. “A minimum sample population (20-25) samples is all that is required for transference of reference ranges.” From this number, they compute an average and a standard deviation and then commit a fatal flaw in dealing with the microbiome. They assume that they have a normal or bell curve distribution. This same naïve mistake is often repeated at laboratories offering 16s services. To illustrate this, we have 146 samples with Lactobacillus crispatus with an average of 7800 but 90% of the samples were less than 7800. The plots below show values of different taxonomy
On the other hand Bacteroidia Class is better behaved, but with mean +/- 2 standard deviation
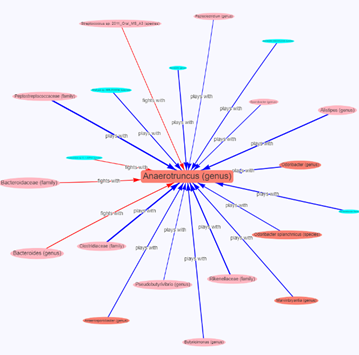
The Correction Solution The correction solution is to compute the actual distribution bacteria by bacteria with a sufficiently large sample and then determine what is in the top or bottom 1%, 3% or 5% of reading. What is your belief? Which test is best, partially depends on your belief as to the cause of the problem. • The traditional (simple and familiar) test assumes one or two bacteria are the cause and from a small collection of candidates. • The 16s view of a microbiome dysfunction is more complex with interactions between bacteria supporting or inhibiting each other. •
Figure 1 Interactions between taxonomies
The more complex view with perhaps a hundred times more bacteria is a challenge. One solution to this is the use of artificial intelligence techniques.
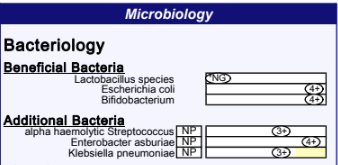
Missing Bacteria (or apparently missing) The biggest challenge when comparing reports is that 16s does not have a 100% match to the traditional reports. The most common complaint is that Escherichia coli appears missing. This is a case of “rose by another name” combined with a little politics over the boogie man called ‘E.Coli’ which is traditionally viewed by most retail consumers as unhealthy and dangerous. Kluyvera and Escherichia genus are not distinguishable using the common 16s rna primers. The primers work only on a portion of the complete DNA and it (unfortunately) happens that this portion have strong similarity between these two. That combined by the bad press E.Coli gets, has likely caused retail testing companies to go with the little known bacteria Kluyera instead.
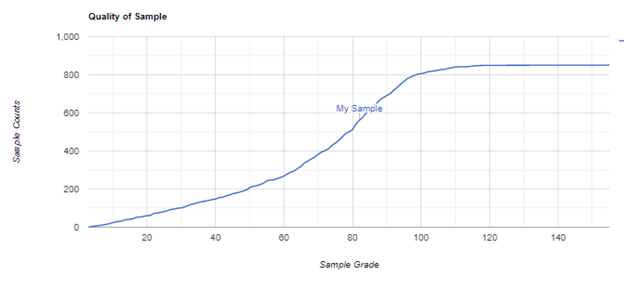
Bottom Line – Which is Better? This really depends on the model that you are working with: • It is dues to just one or two bacteria and you want a simple view without having to deal with interactions and complexities – then the traditional tests is best. • If there are multiple bacteria involved (and most of the research appears to confirm that is the case for many diseases including CFS, Parkinson’s, Alzheimer’s, Diabetes) then you want to use the 16s test and hopefully have access to appropriate tools to evaluate it because there will be massive information overload. Personally, I believe 16s is the better of the two – a lot more information (and thus more effort needed). Units of Measurements Are Different Most 16s reports are units per 1,000,000 bacteria (often the actual count is less, often just 10%, i.e. 100,000 bacteria). count
Figure 2 From 800 samples Counts are in 1000’s
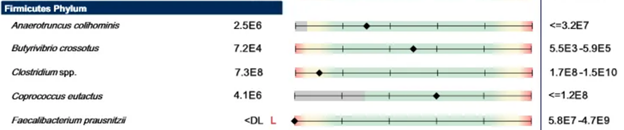
The traditional lab gives a count in Community Forming Units/gram. The use of CFU/g clearly states that the method used is culturing. The size of bacteria seen in nature is reported to vary by 10 orders of magnitude . Weight (as in grams) is the cube of the size dimension, so the weight will vary by 1000 orders of magnitude. Culturing also puts a bias in the relative numbers because some culture better than others. Looking at one lab report, I see reference ranges of 1.5E10 for Roseburia spp and 2.4E5 for Fusobacterium – a difference of 100,000x (E5). Looking at the 16s data from 800+ samples, the median numbers are 368x difference, and the means are 6.4x different.
Figure 3 From Comprehensive Digestive Stool Analysis
Some labs use their own scales which makes it impossible to correlate with other reports is a meaningful way.
Current thinking
“Traditional approaches to describe infectious disease in plants, animals and in humans are based on the concept that single pathogens are responsible for the signs or symptoms of disease observed in those hosts. The concept acknowledges that all organisms are in fact complex communities of viruses, microbes and other small organisms (e.g. parasites) which can interact to affect health or disease status at any given time. These complex communities continually interact with their hosts, sometimes conferring benefits (e.g. “good” bacteria in the human gut microbiome), and at other times causing harm by contributing to disease. When these communities combine to cause disease, they are termed “pathobiomes” — a recognition of their collective shift away from the healthy-state “symbiome.” The recognition that the pathobiome plays a key role in those signs and symptoms of disease that we observe in the host is becoming a more accurate way of considering disease than by simply referring to it as the outcome of the effects of a single pathogen (e.g. the influenza virus).”
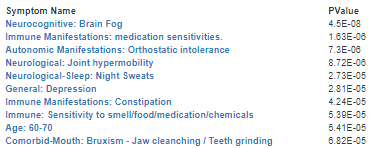
At the citizen science site, http://microbiomeprescription.com/, symptoms (and not diagnosed disease) were found to have very strong correlation using Pearson’s chi-square tests.– even for some age ranges,
Figure 4 A partial listing
This may explain why many studies have contradictory results. The condition group has a diagnosis, for example Chronic Fatigue Syndrome which is defined as: “The Centers for Disease Control and Prevention criteria for chronic fatigue syndrome include severe fatigue lasting longer than six months, as well as presence of at least four of the following physical symptoms:” If symptoms are tied to bacteria shifts, then mixing people with different symptom sets (but the same diagnosis) generates a lot of statistical noise. Bottom Line Using 16s tests opens the door to treat for the symptoms and not for the diagnosis. This also opens the door for uber-personal medicine based on the person’s microbiome. Two people with the same diagnosis (and perhaps significant symptom overlap) may be put on very different treatment plans. A simple example: suppose two persons are suffering from d-lactic acidosis. The bacteria producing d-lactic acid may be very different. One person may have overgrowth of lactobacillus Another person may have Klebsiella pneumoniae and Candida freundii overgrowth .