Attention-deficit syndrome and microbiome

Cognitive impairment is common in CF[2017]. A reader asked about ADHD, the hyperactivity of Attentiondeficit/hyperactivity disorder is not typically reported, but the attention disorder is. There is not much published yet, but a few items were interesting:

“Attention-deficit/hyperactivity disorder (ADHD) is a neurodevelopmental disorder associated with abnormalities in dopamine neurotransmission” [2017]

  • “In a cross-sectional observational study, 123 previously confirmed FMS patients were screened for adult ADHD using the World Health Organization Adult ADHD Self Report scale v1.1. … Of the 123 participants, 44.72% (N = 55) screened positive for adult ADHD. [2017]
  • CFS patients were assessed for childhood and adult ADHD by clinical interview and ADHD-specific scales. Psychopathological comorbidities were evaluated by clinical examination and questionnaires. Forty-seven of 158 CSF patients (29.7%) were diagnosed of childhood ADHD and in 33 (20.9%), the condition persisted into adulthood. CFS patients with adult ADHD had an earlier CSF onset, more severe anxiety and depression symptoms, and a higher risk of suicide than CFS patients without ADHD. ” [2012]
  • “Although the cause of primary Restless Leg Syndrome(RLS) is still unknown, there is a strong connection between central metabolism of iron as well as dopamine levels and RLS manifestation. ” [2011]
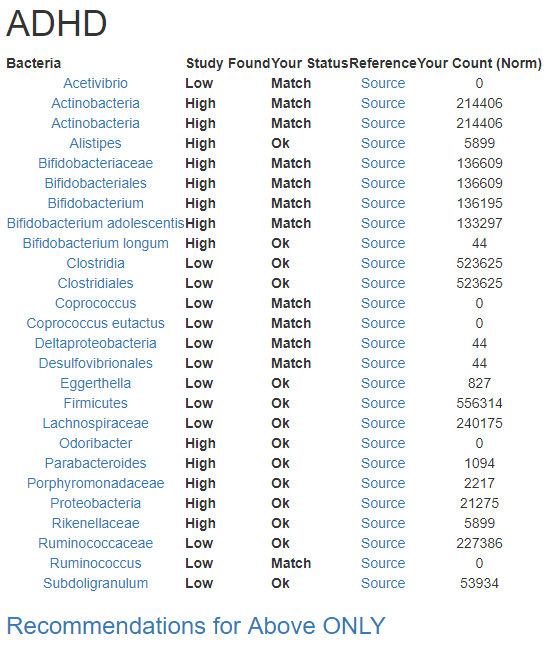
Bacteria Shifts

A recent article  [2017] reported the following shifts

  • Increased Bifidobacterium
  • Increase of Actinobacteria
  • Increased Bifidobacteriales
  • Increased Bifidobacteriaceae
  • Increased Bifidobacterium Longum
  • Increased Bifidobacterium adolescentis
  • Increased Bifidobacterium Pseuodocatenulatum
  • Decreased Firmicutes
  • Decreased Clostridia
  • Decreased Clostridiales
  • Decreased Ruminococcaceae
  • Decreased Subdoliggranulum
  • Decreased Ruminococcus
  • Decreased Acetivibrio
  • Decreased Lachnospiraceae
  • Decreased Coprococcus
  • Decreased Coprococcus eutactus
  • Decreased Eggerthella
  • Decreased Desulfovibrionales
  • Decreased Deltaproteobacteria
  • Increased Proteobacteria
  • Increased Porphyromonadaceae
  • Increased Odoribacter
  • Increased Parabacteroides
  • Increased Rikenellaceae
  • Increased Alistipes

uBiome Analysis Page

If you have uBiome, after uploading/logging in, go to:
http://microbiomeprescription.com/condition/condition?code=3 

And you can see how closely you match the profile.

ADHD.PNG

As always with these conditions, recommendations are available to address the bacteria shifts associated with the conditions.

Bottom Line

The available study was done on Attentiondeficit AND  hyperactivity combined. We do not know which bacteria is associated with with. I would challenge the statisticians / AI / machine learning types to work from the above bacteria and the reported symptoms to try isolating those that are attention-deficit related.

This is an education post to facilitate discussing this approach with your medical professionals. It is not medical advice for the treatment of any medical condition. Always consult with your medical professional before doing any  changes of diet, supplements or activity. Some items cites may interfere with prescription medicines.


Ran into some issues using…

Ran into some issues using “ubiome” in the website name address.

Site is now:
http://microbiomeprescription.com/

I had to roll back to an older version of the site — because I was in the midst of an enhancement.

No data has been lost.

Coming soon — support for all areas in uBiome

This weekend I hope to finish making changes so that throat, nose and other ubiome samples may also be investigated.

Symptoms will be linked to the email + sample date, so there is no need to re-enter symptoms. This would allow people to see the impact of changes in mouth health by changes in habits they implemented.

Recommendations will continue to be ONLY for gut — there are not enough studies to venture into other areas.  BUT, if you start chewing mastic gum (something that I have suggested before), you should see the impact on your throat and nose bacteria.

Also simplified recommendations are being worked on.

Many items appear under 3-6 different names in the literature. The citation used the term used in the study. The simplification will replace things like:

with just resveratrol (whatever the common name of a supplement is).

This will impact some recommendations because we will stop double counting or under counting some modifiers.

Simple Summary of Progress between uBiome Samples

In my earlier post, COMPARING REPEATED UBIOME RESULTS, I provided a tool but little guidance on interpreting. The key question is always whether the symptoms improved, not whether some numbers change. We do not know which numbers are significant and which numbers are just natural variation.

Model Of Onset

People see progression of symptoms since onset. Each progression is likely associated with a set of changes in the uBiome. This can be represented in the chart below (which likely have a lot more items than shown).

Onset

Model Of Recovery

Our Wishful Model

This appears to happen in two scenarios:

  • Chemotherapy for Cancer in some cases
  • Fecal Matter Transplants — but usually do not persist longer than a few weeks

cure

Probable reality

This model comes from the model that we may have more than a dozen bacteria groups involved in the symptoms. For depression alone, we see 28!!. Being able to correct all of them in one-go is not likely. You may correct one and those not effected adapt to try entrenching themselves better (like filling the empty space of the bacteria reduced).

Route

Interpreting results of Comparisons

I am looking at a person with two samples. I have not automated the comparisons shown below, instead I selected a sample and then went to the page and did a simple count.

Over all, we went from 31 matches to 27 matches. One increased and three decreased — I wish it was possible to do decrease across all items…

Comparison Report – Summary

The original detail was done as a quickly and dirty report comparing numbers and attempts to keep people from becoming excessively focus on numbers (which we are not certain of significance – some are likely important and some are not… we do not know for sure which ones are).

From feedback, it is clear that a simpler report, the summary, would be easier to understand and likely more beneficial

Time between samples: 10 months

Metabolism is likely the most significant

Like the profiles used above, this filters ‘noise’ and looks at the net result of a lot of different bacteria.  I have just added a new item to the report

Average Metabolism (Ideal healthy would be 1.0)

  • Early sample 1.32
  • Later Sample 1.18

In short, the metabolism is improving greatly.

New and Updated Pages

There are now two buttons available for comparison

u1

The new report is Summary, and an example is shown below. The most significant ones are high lighted.

U2

  • Profiles – this means the total matches for all of the conditions we have profiles on
    • We see a decrease from 59 matches to 53.
    • The individual profiles are listed in plain text
    • A decrease suggests moving away from an autoimmune state
    • This is an objective measurement
  • Symptoms:
    • Symptoms are subjective, ideally we would like to see a decrease
    • Go to the detail reports to see what symptoms changed.
  • Metabolism Average
    • This is the average of the values transcribed from uBiome.
    • A perfect (healthy) score is 1.0
    • This is an objective measurement
  • Metabolism Standard Deviation
    • This is a measure of how scattered from a healthy score you are
    • A perfect (healthy) score is 0.0
    • This is an objective measurement

Bottom Line

The new summary page give you three objective measures of your progress. For the reader above, all three objective measures improved. The subjective measure (number of symptoms) increased — we do not record severity of symptoms because that is so-so-so very subjective, just a count.

Whiplash on Recommendations

The reader found that the recommendations changed a lot between the two samples. A change is expected if progress is made. Conceptually, the number of items with a high (or low — for avoid) should decrease if progress is made.  We see this in the samples of this reader, as shown below.

Take Lists

For Example 1, we had the > 4 take

amoxicillin
Azithromycin
florfenicol
Cranberry bean flour
Bacillus subtilis natto
Gallate
Flaxseed
High Fat
Plant-rich diet
ß-lactam antibiotics
Tannin
Trimethoprim-sulfamethoxazole
Vitamin D
Polymannuronic acid

For Example 2, the list has grown smaller, with some new items appearing

Polymannuronic acid
Ketogenic diet
Lactobacillus kefiri
Low fat diets
L-Taurine
Lactobacillus plantarum
Bacillus subtilis natto

Avoid Lists

For Exampl1, the < -4 list

Arabinoxylans
black raspberries
Acetic acid
Chrysanthemum morifolium
ibuprofen
Isobutyric acid
Isovaleric acid
Sunflower Oil
High fruit intake
barley
Saccharin
Saccharomyces boulardii
animal-based protein
High meat diet
Fraxinus angustifolia
berberine

For Example 2, the list is again smaller for < -4, with a few items in common

Walnuts
Navy bean
berberine
High protein diet
Carboxymethyl cellulose
Polysorbate 80
ku ding cha tea
barley
Fraxinus angustifolia


Depression and the Microbiome Revisited

I have done a few posts on depression over the years

A friend asked me to revisit it, especially now that I have a recommendation program working.

Depression and the Microbiome – PubMed

From The role of microbiota in the pathogenesis of schizophrenia and major depressive disorder and the possibility of targeting microbiota as a treatment option [2017].

  • over-presentation of the orders of Bacteroidales and
  • under-presentation of the orders of  Lachnospiraceae,
  • Higher level of Oscillibacter and Alistipes had higher depression
  •  increased levels of Enterobacteriaceae and Alistipes
  •  reduced levels of Faecalibacterium 

Altered fecal microbiota composition in patients with major depressive disorder [2015]. adds that “Bacterial diversity was significantly higher ” and also reported additionally (for two types of depression):

  • higher Bacteroidaceae,
  • higher Butyricimonas,
  • higher Clostridium XlVb
  • higher Enterobacteriaceae,
  • higher Parabacteroides,
  • higher Phascolarctobacterium,
  • higher Porphyromonadaceae,
  • higher Rikenellaceae
  • higher Roseburia
  • higher Acidaminococcaceae,
  • higher Flavonifractor,
  • higher Proteobacteria
  • lower Actinobacteria
  • lower Fusobacteria,
  • lower Ruminococcaceae,
  • lower Veillonellaceae 
  • lower Lachnospiraceae,
  • lower Dialister,
  • lower Escherichia/Shigella,
  • lower Firmicutes,
  • lower Haemophilus,
  • lower Prevotella,
  • lower Ruminococcus

Additionally, Isovaleric acid in stool correlates with human depression.[2016] hence isovaleric acid producing bacteria appear to be another facet.

Isovaleric acid producing bacteria includes [ref]:

  • Bacillus subtilis natto
  • Prevotella
  • Porphyromonas

Automated Analysis of your Ubiome

After you logged on to http://microbiomeprescription.com/  This Depression link will show your results against the above list. As a reminder, there are other comparisons available:

The result is a report such as shown below

Depression

At the bottom is a link to recommendations for the ‘Match’ items above only. That is, the recommendations are specific to the depression symptom.

recomm


For the first one on the list, I did a google and found lots of pages saying that pomegranate helps depression!

Imagine that! With the microbiome approach, you are getting truly individualized suggestions and not proforma suggestions.


This is an education post to facilitate discussing this approach with your medical professionals. It is not medical advice for the treatment of any medical condition. Always consult with your medical professional before doing any  changes of diet, supplements or activity. Some items cites may interfere with prescription medicines.