
New Lab Analysis report for input has been added:
http://microbiomeprescription.com/Kyber/Verisana
Category Archives: Conditions
Website for AI on KyberCompact Reports
I did a KyberKompact analysis a while back, and just put the same same thru my new website to do analysis.
The page is at: http://microbiomeprescription.com/Kyber/Upload/
The process is simple, match the up and down errors for the items on the reports.
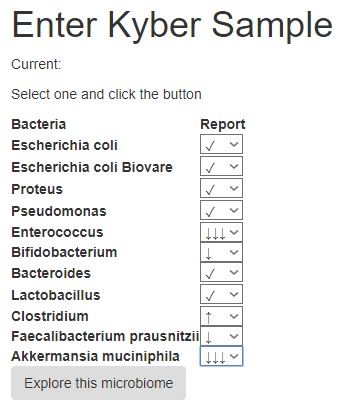
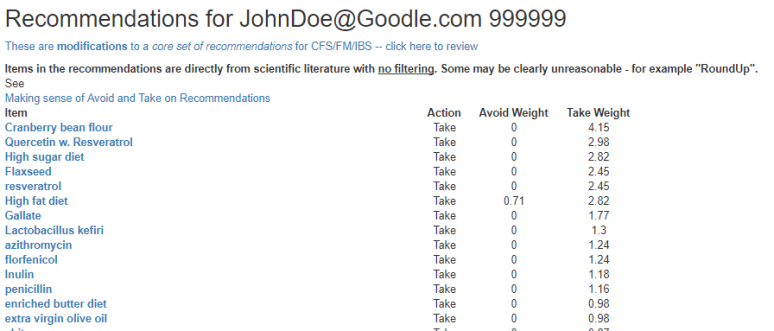
Click explore and the current recommendations appear (based on published studies) as shown below.
- You can also take your ubiome results and match up with the selection shown above and use it that way until I get the uBiome version fully tested.
- Clicking on include/parent will increase the recommendations to include the parent (i.e. “family”) or children (“strains”) recommendations
- As is 142 items appeared, with parents and children the list increased to 162 items.
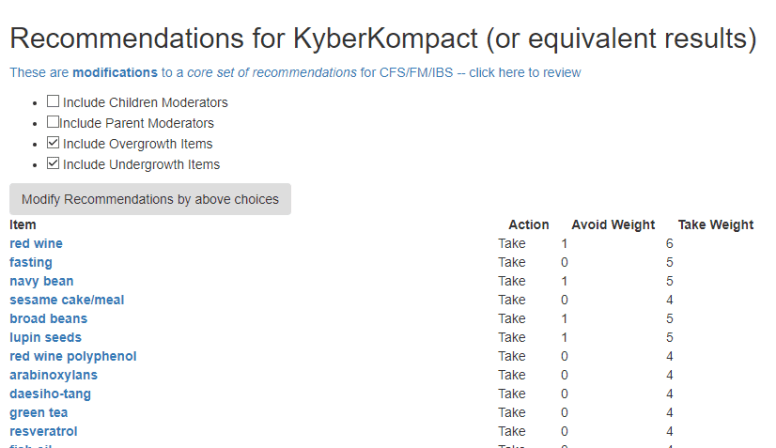
There are some similar to items (i.e. red wine, resveratrol , red wine polyphenol).
The full list is shown below:
Bottom Line
The number of items above will grow as more and more studies are entered into the database.
This is an education post to facilitate discussing this approach with your medical professionals. It is not medical advice for the treatment of CFS. Always consult with your medical professional before doing any changes of diet, supplements or activity. Some items cites may interfere with prescription medicines.
Comparing uBiomes from different dates
A reader sent me over two uBiomes taken 3 months apart and was confused by the results. Fortunately, I could upload her data and do some quick analysis (which will eventually be available as a web page).
Phylum Level Is Improving
The numbers below are the counts. It they are getting closer to normal, it is improving. If further away then a loss.
| October | December | Normal | tax_name | tax_rank | Change |
| 15453 | 10574 | 45026 | Actinobacteria | phylum | Loss |
| 701911 | 424855 | 271874 | Bacteroidetes | phylum | Improved |
| 60 | 9124 | 38 | Euryarchaeota | phylum | Loss |
| 269622 | 527597 | 561301 | Firmicutes | phylum | Improved |
| 12694 | 22898 | 32511 | Proteobacteria | phylum | Improved |
| 271 | 512 | 4200 | Synergistetes | phylum | Improved |
We see a rare phylum (Euryarchaeota) was one of the two losses, so we really had 4 gains to 1 loss.
Class Changes
The dominant change at the class level are improvement if we take by raw counts. Both Clostridia and Bacteroidia (the two biggest classes have improved). The third largest class Erysipelotrichia has had a loss.
| October | December | Normal | tax_name | tax_rank | Change |
| 15453 | 10574 | 45026 | Actinobacteria | class | Loss |
| 120 | 3024 | 24677 | Alphaproteobacteria | class | Improved |
| 15544 | 8799 | 20967 | Bacilli | class | Loss |
| 701911 | 424855 | 270991 | Bacteroidia | class | Improved |
| 527 | 12086 | 12351 | Betaproteobacteria | class | Improved |
| 221346 | 469302 | 511846 | Clostridia | class | Improved |
| 1191 | 6249 | 3903 | Deltaproteobacteria | class | Improved |
| 5367 | 1337 | 7271 | Epsilonproteobacteria | class | Loss |
| 15785 | 36597 | 10249 | Erysipelotrichia | class | Loss |
| 5488 | 199 | 24696 | Gammaproteobacteria | class | Loss |
| 60 | 9124 | 38 | Methanobacteria | class | Loss |
| 16946 | 12899 | 24121 | Negativicutes | class | Loss |
For this overgrowth, we have some suggestions.
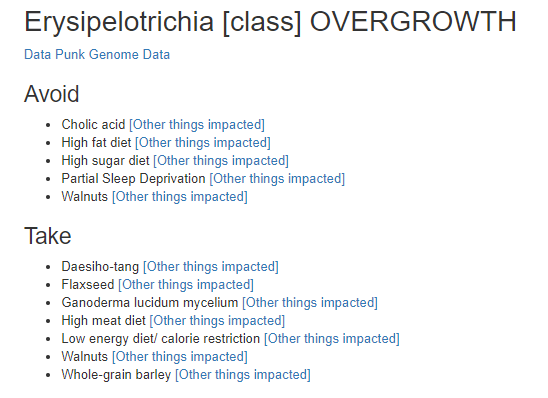
NOTE: Walnut is reported at two places. We have contrary results from studies 😦
Order Changes
We see gain and loss here too.
| October | December | Normal | tax_name | tax_rank | Change |
| 5261 | 2899 | 23920 | Actinomycetales | order | Loss |
| 346 | 249 | 15243 | Bacillales | order | Loss |
| 701911 | 424855 | 268676 | Bacteroidales | order | Improved |
| 527 | 11974 | 11721 | Burkholderiales | order | Improved |
| 5367 | 1337 | 7271 | Campylobacterales | order | Loss |
| 221346 | 468964 | 512463 | Clostridiales | order | Improved |
| 2140 | 7674 | 21896 | Coriobacteriales | order | Improved |
| 1191 | 6249 | 3544 | Desulfovibrionales | order | Loss |
| 15785 | 36597 | 10192 | Erysipelotrichales | order | Loss |
| 15197 | 8549 | 19016 | Lactobacillales | order | Loss |
| 60 | 9124 | 38 | Methanobacteriales | order | Loss |
| 180 | 199 | 6984 | Pasteurellales | order | Improved |
| 120 | 24 | 41600 | Rhizobiales | order | Loss |
| 16946 | 12899 | 24121 | Selenomonadales | order | Loss |
| 271 | 512 | 4200 | Synergistales | order | Improved |
The worst loss was for Rhizobiales, with the following suggestions coming from the website
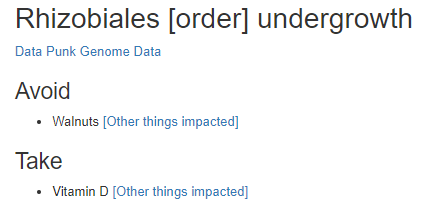
It is now clear that walnuts should be avoided.
Bottom Line
One concern that I have asked is about undergrowth. Working at the genus level gets very complex here. Working at higher levels like phylum, class and order is simpler.
With this new comparison page proposed, you get better clarity of the numbers and can focus on the highest count targets.
This is an education post to facilitate discussing this approach with your medical professionals. It is not medical advice for the treatment of any condition. Always consult with your medical professional before doing any changes of diet, supplements or activity. Some items cites may interfere with prescription medicines.
How to upload your uBiome for analysis [Updated]
Uploads are welcome for all conditions
- PLEASE Add your symptoms after uploading so your ubiome may be used to detect patterns. see Adding Symptoms to your uBiome.
Downloading your uBiome data
After logging into uBiome, you will see an ‘Advanced’ tab on your menu bar.
- Click it
- A dropdown menu will appear
- Click ‘Download’
- Choices will appear on the left.
Some people report not seeing this. Wait 60 seconds and press F5 (Refresh) — it will usually appear then.
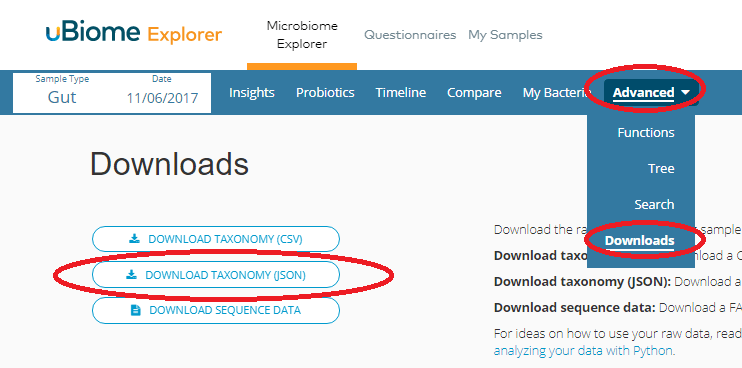
- Click on Download Taxonomy (Json)
- Depending on your browser, you may see the data in a new tab or be prompted for a name
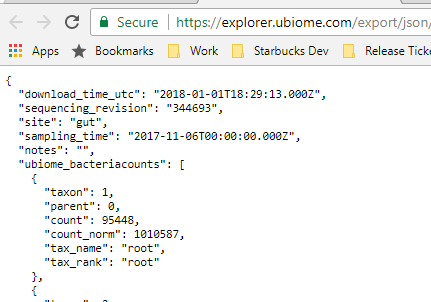
- If the above case, a Control- S should bring up a dialog to save it:
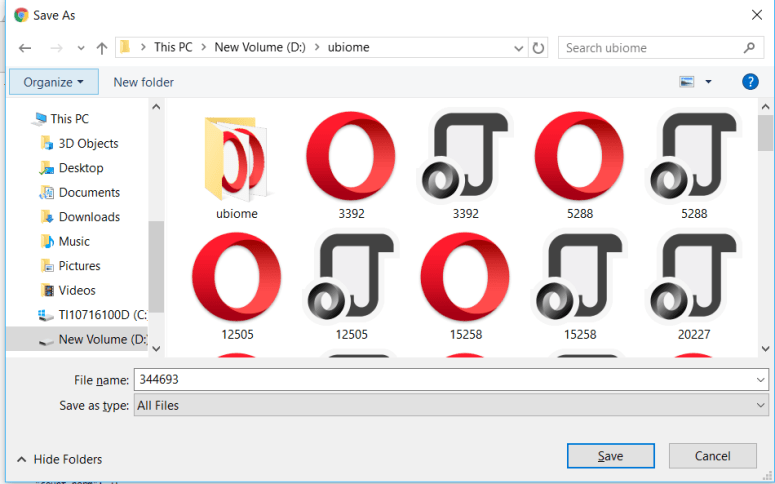
- I usually add .json to the end
Using A Mac
- MAC’s will often save it as a .webarchive which will not work for an upload. So:
- Open a Text Editor
- Copy the entire page and paste it into the text editor.
- Save the file
You are now ready to upload!
Uploading
Go to http://microbiomeprescription.com/Home/Upload
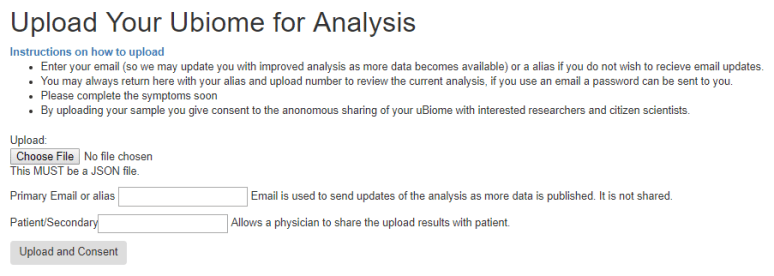
Enter your email and select the file you downloaded above. Then click ‘Upload and Consent’.
- You may enter a second email or label to help you track the sample.
Choices After Uploading
After uploading you will see three choices (more if you have uploaded multiple samples).
- The first one takes you to recommendations
- The second one takes you to a screen to record or update your symptoms
- The third one allows you to change the extra email or label on the sample.
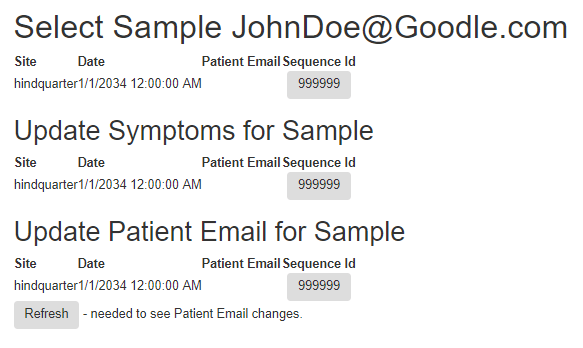
Top Choice – Recommendations
At present, the recommendations are based on OVERGROWTH only. This will be improved in the future
Visual Display in a Tree
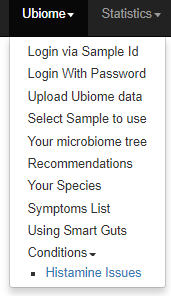
On the menus you will see “Your microbiome tree”
This will display your data in a tree with overgrowth in red.

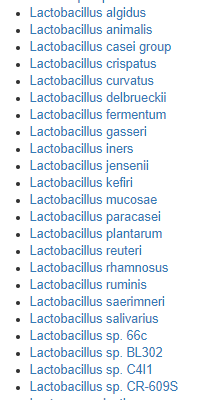
Your Species
Another choice on the menu is “Your species” – This is in the download from uBiome but they do not display it on their site. You can see them here. An example is below (do not expect to see this many)
The Second Choice is Adding symptoms
I will cover this in another post, Adding Symptoms to your uBiome.
Bottom Line
The login above, “JohnDoe@Goodle.com” with sample Id “999999” was created as a composite from uploads available when I did this post. Feel free to try it to get a feel of the site before you do an upload.
This is an education post to facilitate discussing this approach with your medical professionals. It is not medical advice for the treatment of any condition. Always consult with your medical professional before doing any changes of diet, supplements or activity. Some items cites may interfere with prescription medicines.
Demo #1 Analysis from New Website
I have programmed (and hopefully improved) my process for analysis of uBiomes. It is still being debugged (and I doing a few of my backlog to test it).
See your Microbiome shifts in a tree
This allows a much clearer view of where hotspots of overgrowth are occurring.
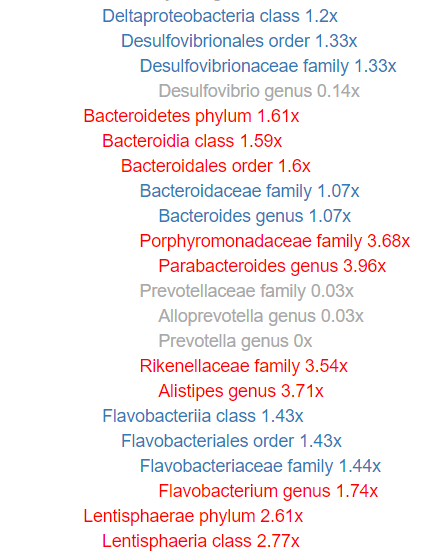
The factor shown are NOT from ubiome, but from my estimates (which will evolve). So what are uBiomes numbers?
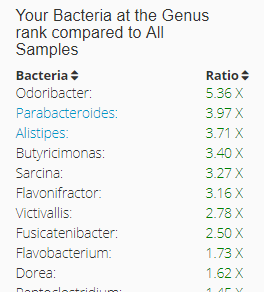
We are close, very close (1.74 vs 1.73, 3.71 vs 3.71, 3.96 vs 3.97).
All of the bacteria levels are hyperlinked to more information about each.
Recommendations
Recommendations are often increased and there can be some conflicts. For example, Walnuts, High Fat Diet, Vitamin D. This is because different bacteria reacts differently.
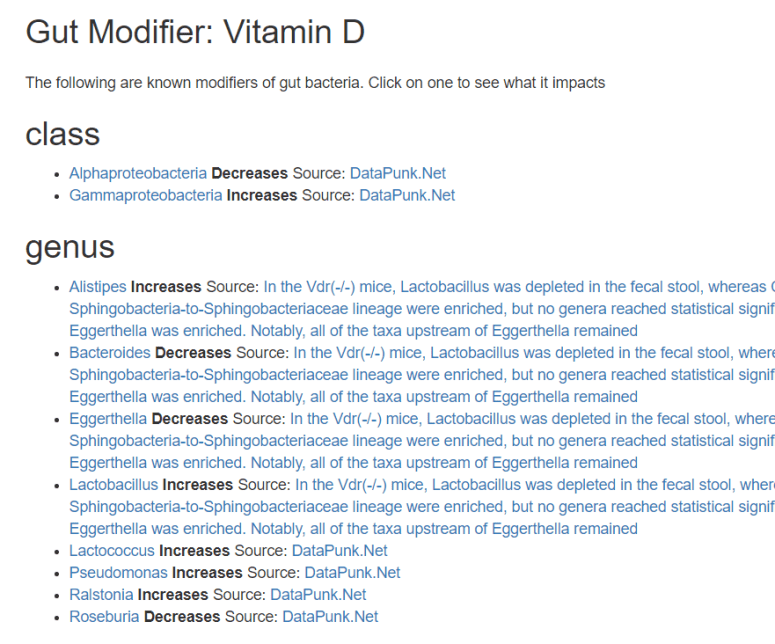
Learning More
Clicking on an item like Vitamin D, will show you what we know that vitamin D changes (with the source of information)
Bottom Line
The new do-the-analysis yourself site does a deeper evaluations of each item and their impact with full transparency to the data source.
I hope to have public uploads enabled within the week. There is a lot of data to be added to it, so it may be a month or more before that is complete. DataPunk data is complete — so there is a reasonable amount of data now (i.e. for the above, we have a long list of items suggested already).
If there are too many items, just go for the ones with the highest weights.
